Avui compleixo 48, i si alguna cosa m’ha ensenyat el temps és que l’experiència no arriba només amb els anys, sinó amb les vivències que ens transformen.
Fa molt vaig entendre que la vida no et dona manuals. Et dona moments. I alguns d’ells et trenquen per dins… però també són els que t’ajuden a créixer de veritat.
– La mort del meu pare va ser el primer gran cop. Ho recordo en detalls petits, invisibles per als altres però inesborrables per a mi. Encara avui, qualsevol gest quotidià pot portar-me la seva imatge.
– L’accident de cotxe va marcar el final de la meva adolescència i l’inici d’una nova manera de veure el món.
– La pèrdua del meu fill Pol ha estat, sens dubte, l’experiència més dura. Encara avui, recordar-ho m’omple els ulls de llàgrimes… però també m’ha ensenyat a valorar i agrair cada instant amb més intensitat.
Amb els anys he après a mirar la vida com un rellotge de sorra. La sorra que ja ha caigut ha perdut el seu color original: s’ha convertit en experiència. I la que queda a dalt… ja no té l’energia dels 20 anys. Als 48, aquesta energia canvia, però gana en consciència, en sentit, en profunditat.
El pas del temps no és lineal, ni just, ni previsible. Però sí que podem triar com mirar-ho: amb nostàlgia o amb gratitud. Jo he triat agrair. He triat construir. I, sobretot, he triat ser fidel a mi mateix.
La vida no va de trobar-se, va de crear-se. I sí, avui avui m’he llevat a les 5 del matí per a escriure això, perquè em recorda qui soc, d’on vinc i tot el que encara em queda per viure.
Gràcies a totes les persones que m’heu acompanyat en aquest viatge. La millor recompensa? La família que hem creat Estefania i jo, que s’ha convertit en el Sol al voltant del qual gira tot.
Avui, més que mai, em sento plenament autor d’aquesta obra que anomenem vida.
#FeliçAniversari #CreixementPersonal #Gratitud #PNL #Experiència #Feliços48 #Tete i #Fàtima
In Linux, managing network traffic is essential for a robust and secure IT infrastructure. In this post, we focus on Ubuntu—whether running on a virtual machine, Windows Subsystem for Linux (WSL), or a physical machine running Ubuntu 24.04. We will configure per-domain DNS rules using dnsmasq. This guide also covers additional considerations for WSL and systems using netplan.
Configuring Ubuntu for Local DNS with dnsmasq
When using Ubuntu, you might be using netplan for network configuration. In that case, you need to configure netplan to use the local DNS server provided by dnsmasq. Make sure your netplan configuration (e.g., /etc/netplan/01-netcfg.yaml) sets the DNS to 127.0.0.1, so that all DNS queries are forwarded to your local dnsmasq server.
Disabling systemd-resolved
Ubuntu often uses systemd-resolved by default, which can interfere with your custom DNS setup. To prevent conflicts, disable and stop systemd-resolved using the following commands:
This ensures that systemd-resolved does not override your DNS settings.
Note for WSL Users
If you are running Ubuntu under WSL, you need to prevent WSL from overwriting your DNS settings. Edit or create the file /etc/wsl.conf with the following content:
[network]generateResolvConf=false
Then, create or edit the /etc/resolv.conf file to include:
nameserver127.0.0.1
This ensures that your system uses the local dnsmasq server.
Installing and Setting Up dnsmasq
Step 1: Install dnsmasq
First, update your package list and install dnsmasq:
sudoaptupdatesudoaptinstalldnsmasq
Step 2: Enable and Verify the dnsmasq Service
After installing dnsmasq, enable the service and check its status to ensure it is running correctly:
You should see that dnsmasq is active and running. This local DNS server will be used to resolve all DNS queries forwarded from your system.
Step 3: Configure dnsmasq
Edit the /etc/dnsmasq.conf file to set up your DNS rules. Here’s an example configuration:
# Default upstream DNS serversserver=8.8.8.8server=8.8.4.4# Domain-specific DNS serversserver=/domain01.tld/172.30.0.1server=/domain02.tld/172.30.0.2
Explanation:
The lines server=8.8.8.8 and server=8.8.4.4 set Google’s public DNS as the default upstream DNS servers. When a query does not match any domain-specific rule, dnsmasq will forward the request to these servers.
The lines server=/domain01.tld/172.30.0.1 and server=/domain02.tld/172.30.0.2 specify that queries for any host within domain01.tld and domain02.tld should be resolved by the DNS servers at 172.30.0.1 and 172.30.0.2, respectively.
After making your changes, save the file and restart dnsmasq to apply the new configuration:
sudosystemctlrestartdnsmasq
Verifying the DNS Configuration
You can use the dig command to verify that your DNS rules are working as expected. Note that when your system’s resolver is set to use dnsmasq at 127.0.0.1, the dig output will always show SERVER: 127.0.0.1#53. However, dnsmasq will forward the query internally to the appropriate upstream DNS server based on your configuration.
Below are two examples: one for a public domain (google.com) and one for a domain that should be resolved by your custom DNS rule (example01.tld).
Example 1: Verifying a Public Domain (google.com)
Run the following command:
diggoogle.com
Simulated Output:
; <<>> DiG 9.11.3-1ubuntu1-Ubuntu <<>> google.com;; global options:+cmd;; Got answer:;; ->>HEADER<<- opcode:QUERY, status:NOERROR, id:12345;; flags:qr rd ra; QUERY:1, ANSWER:2, AUTHORITY:0, ADDITIONAL:1;; QUESTION SECTION:;google.com. IN A;; ANSWER SECTION:google.com. 300 IN A 172.217.164.110google.com. 300 IN A 172.217.164.78;; Query time:23 msec;; SERVER:127.0.0.1#53(127.0.0.1);; WHEN:Wed Feb 20 10:00:00 UTC 2025;; MSG SIZE rcvd:113
Internal Process:
Step 1: The query for google.com is sent to the local dnsmasq server at 127.0.0.1.
Step 2: dnsmasq examines its configuration and sees that google.com does not match any domain-specific rules.
Step 3: It then forwards the query to the default upstream DNS servers (8.8.8.8 and 8.8.4.4).
Step 4: The upstream server resolves google.com and returns the result back to dnsmasq, which then passes it back to the client.
Example 2: Verifying a Domain with a Custom DNS Rule (example01.tld)
Run the following command:
digexample01.tld
Simulated Output:
; <<>> DiG 9.11.3-1ubuntu1-Ubuntu <<>> example01.tld;; global options:+cmd;; Got answer:;; ->>HEADER<<- opcode:QUERY, status:NOERROR, id:67890;; flags:qr rd ra; QUERY:1, ANSWER:1, AUTHORITY:0, ADDITIONAL:1;; QUESTION SECTION:;example01.tld. IN A;; ANSWER SECTION:example01.tld. 60 IN A 172.30.0.1;; Query time:25 msec;; SERVER:127.0.0.1#53(127.0.0.1);; WHEN:Wed Feb 20 10:00:10 UTC 2025;; MSG SIZE rcvd:82
Internal Process:
Step 1: The query for example01.tld is sent to dnsmasq at 127.0.0.1.
Step 2: dnsmasq checks its configuration and finds a matching domain-specific rule for example01.tld, which directs the query to the DNS server at 172.30.0.1.
Step 3: dnsmasq forwards the query internally to 172.30.0.1 without exposing this step in the client’s dig output.
Step 4: The upstream server at 172.30.0.1 resolves the query, and dnsmasq returns the answer to the client.
In both cases, while the client sees the query being handled by 127.0.0.1, dnsmasq intelligently directs the queries to the appropriate upstream servers based on your configuration. This seamless internal forwarding is what allows you to manage per-domain DNS resolution effectively.
Conclusion: Why Use Per-Domain DNS Configuration?
Implementing per-domain DNS configuration on Linux Ubuntu is a powerful way to gain granular control over your network’s behavior. This approach is particularly useful for:
Enterprise Environments: Where internal domains require different DNS resolutions from external queries.
Development and Testing: Allowing developers to redirect domain requests to local or test servers.
Security: Enhancing network security by segregating traffic and reducing reliance on external DNS servers.
By configuring dnsmasq with domain-specific rules and ensuring that your system points to the local DNS (especially important when using netplan or running under WSL), you optimize network performance and security tailored to your specific needs.
For example, we use NPM (Nginx Proxy Manager). The Web User Interface (WUI) of NPM relies on a backend API. By inspecting your browser’s network requests, you can observe how it functions.
However, I was unable to find comprehensive documentation for this API. With a bit of research, you can discover that the NPM API exposes its schema in a specific location:
https://npm.your-domain.tld/api/schema
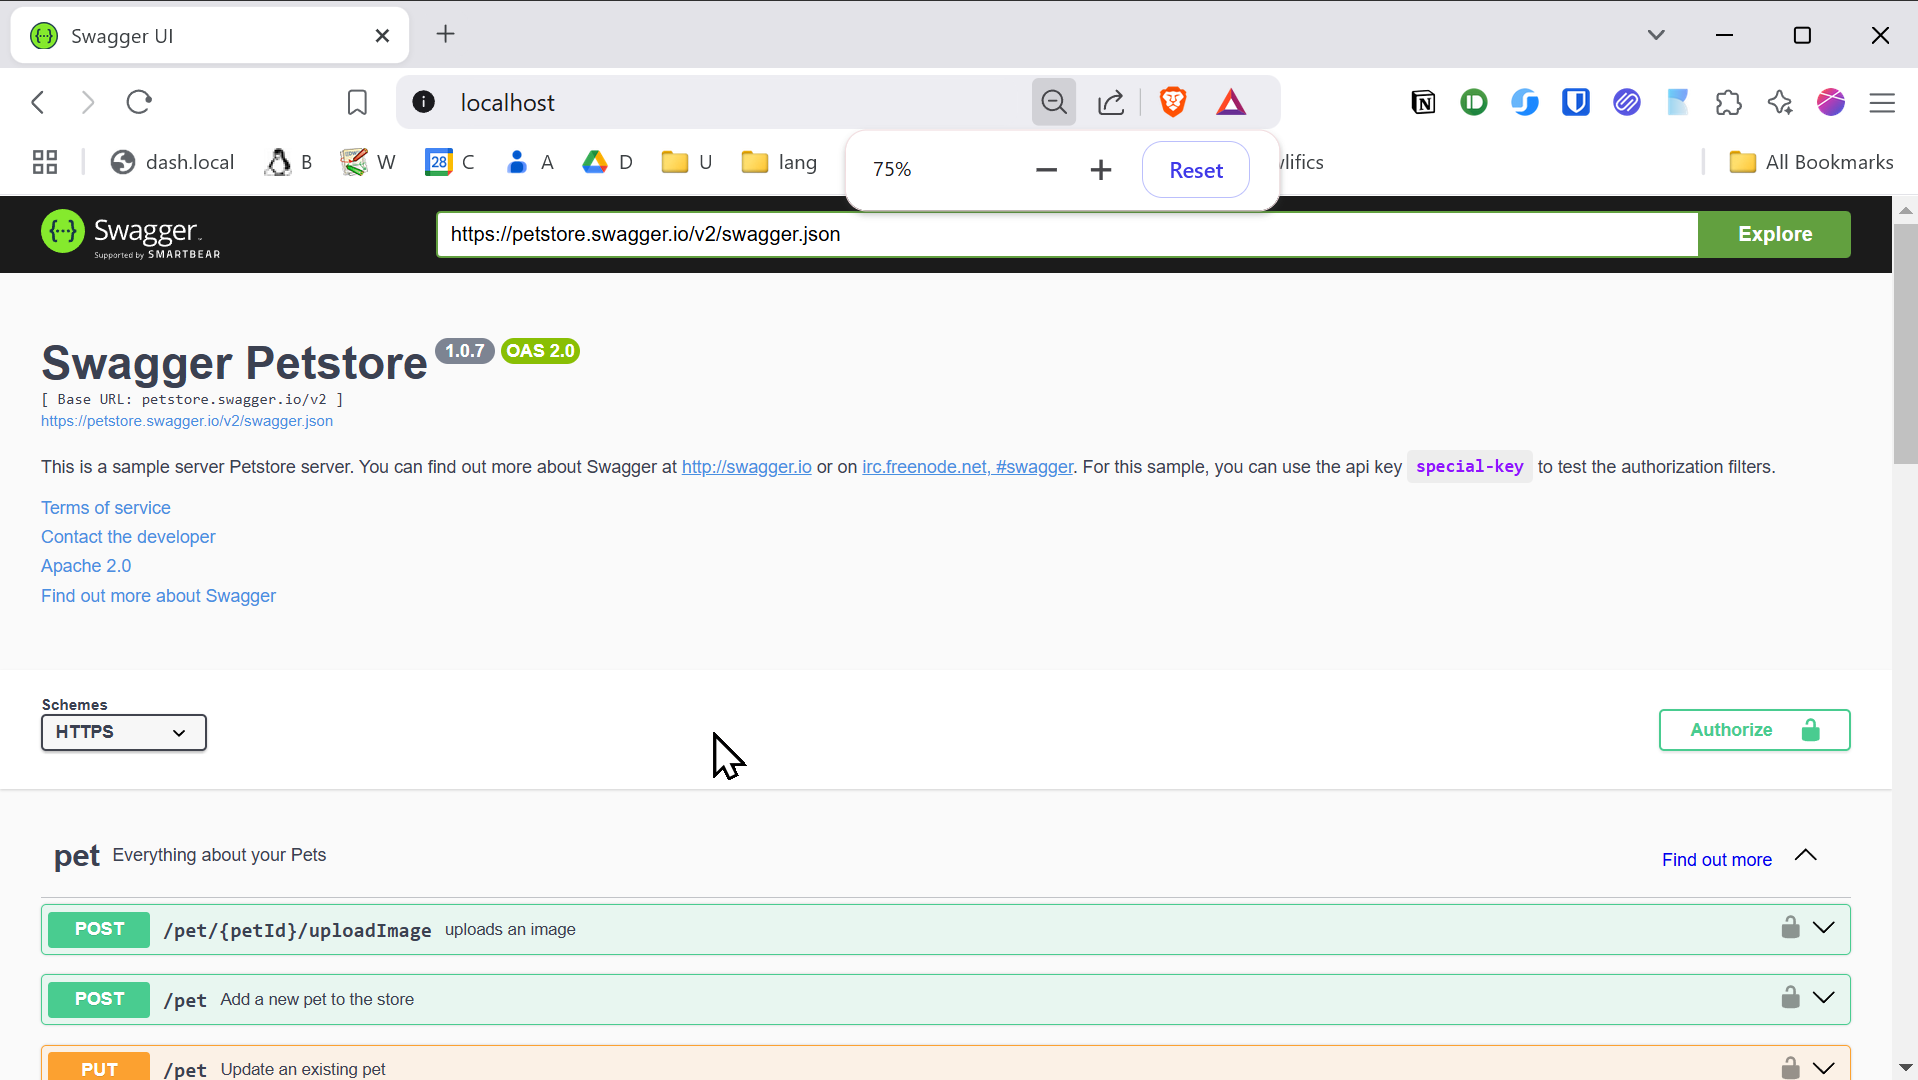
If you’re looking for a convenient web-based API client along with a documented interface to help you understand how to use it, simply run the following Docker container:
dockerrun-p80:8080-dswaggerapi/swagger-ui
Open your browser and navigate to http://localhost, and you will see something like this:
Finally, replace the Petstore API URL with your own, such as https://npm.your-domain.tld/api/schema, or any OpenAPI URL you wish to use.
Below is a screenshot of my local NPM setup:
I hope this post has been helpful to you. Thank you for taking the time to read it.
En este artículo explicamos de manera práctica los formatos más comunes de certificados digitales y cómo manipular las claves privadas asociadas. Conocer estos formatos y comandos te permitirá gestionar correctamente tus certificados para su uso en entornos que requieren seguridad y automatización.
Formatos de Certificados
Formato PEM (Privacy Enhanced Mail)
El formato PEM es legible por humanos, ya que utiliza una codificación Base64 en ASCII. Un certificado en este formato comienza con la línea ----BEGIN CERTIFICATE----. Este es el formato requerido para instalar certificados en el trust store (conjunto de certificados de entidades de confianza).
Formato DER (Distinguished Encoding Rules)
El formato DER es un formato binario, más compacto y no legible directamente. Si al inspeccionar tu certificado no ves la línea inicial típica de PEM, probablemente se trate de un certificado en formato DER.
Conversión de DER a PEM
Para instalar un certificado en el trust store, es necesario que esté en formato PEM. Si dispones de un certificado en formato DER, por ejemplo local-ca.der, puedes convertirlo a PEM usando el siguiente comando:
El formato PKCS#12 permite empaquetar tanto el certificado como la clave privada y, opcionalmente, la certificate chain (secuencia de certificados intermedios que verifican la validez del certificado). Es muy útil para exportar e importar credenciales completas de forma segura, ya que el archivo resultante (normalmente con extensión .p12) puede estar protegido por una contraseña. Es importante tener en cuenta que, si la clave privada de un certificado no se encuentra dentro de la PKI, no se podrá exportar en formato PKCS#12. En el entorno de easy-rsa, puedes exportar un certificado y su clave privada en formato PKCS#12 con el siguiente comando:
Las claves privadas suelen estar protegidas mediante cifrado simétrico, lo que significa que se necesita una passphrase (contraseña) para descifrarlas y utilizarlas. Esta protección es fundamental para evitar el uso no autorizado de la clave en caso de pérdida o robo. En ocasiones, es necesario eliminar o modificar la passphrase para facilitar su uso en ciertos entornos o automatizaciones.
Eliminar la Passphrase
Para eliminar la passphrase de una clave privada, puedes usar el siguiente comando:
opensslrsa-in [original.key] -out [new.key]
Si prefieres realizarlo de manera no interactiva, especificando la contraseña directamente en el comando:
Si deseas cambiar la passphrase y proteger la clave con un nuevo cifrado (por ejemplo, AES-256), puedes hacerlo de la siguiente forma:
opensslrsa-aes256-inoriginal.key-outnew.key
Cierre
Con la información explicada en este artículo, podrás gestionar y convertir certificados entre formatos PEM y DER, empaquetar tus credenciales en formato PKCS#12 y manipular las claves privadas según tus necesidades. Estos conocimientos te permitirán implementar soluciones seguras y automatizadas en tus entornos de desarrollo y producción.
En este post presentamos un proof-of-concept para configurar un broker MQTT utilizando Mosquitto, en el que se implementa TLS gracias a los certificados de Let’s Encrypt. Este método aporta varias ventajas frente a las soluciones tradicionales:
No requiere exposición pública: El servidor no tiene que estar expuesto a Internet; únicamente el nombre de dominio debe resolverse correctamente en DNS, lo que minimiza la superficie de ataque.
Facilidad de uso: Con Certbot y herramientas automatizadas (como Just), se simplifica el proceso de emisión y renovación de certificados.
Esta aproximación es ideal para entornos privados, de desarrollo o pruebas de concepto, donde se desea un equilibrio entre seguridad y comodidad.
Demostración en vídeo
Requisitos
Nombre de dominio: Un dominio válido (por ejemplo, mqtt.example.com).
Certbot: Herramienta para obtener certificados de Let’s Encrypt.
Just: Un command runner que simplifica la ejecución de tareas (consulta el Justfile para ver los comandos disponibles).
Mosquitto: El software del broker MQTT.
Configuración
Obtención de Certificados con Certbot
Let’s Encrypt permite obtener certificados TLS gratuitos y automatizados. Ten en cuenta que, a diferencia de otras implementaciones, Let’s Encrypt no soporta certificados para clientes, por lo que solo se generará el certificado para el servidor.
Existen dos métodos habituales para validar la propiedad del dominio:
HTTP-01 Challenge: Requiere disponer de un servidor web en funcionamiento.
DNS-01 Challenge: Consiste en añadir un registro TXT en el DNS, ideal si no dispones de una IP pública o de un servidor web.
Importante: Asegúrate de que el nombre distinguido (DN) del certificado coincide exactamente con el hostname que usarán los clientes para conectarse y que este se resuelve correctamente en DNS.
Instalación
Para comenzar, crea un entorno virtual e instala Certbot:
uvvenvuvpipinstallcertbot
Solicitud del Certificado
Emplea la siguiente sintaxis para solicitar el certificado:
Si la solicitud es exitosa, los certificados se ubicarán en la ruta:
certbot/config/live/<dominio>
Dentro de este directorio encontrarás:
privkey.pem: Tu clave privada.
fullchain.pem: La cadena completa de certificados, que es la que se utiliza en la mayoría de las configuraciones de servidor.
chain.pem: Certificados intermedios (útiles, por ejemplo, para OCSP stapling en Nginx >=1.3.7).
cert.pem: Un certificado que puede generar conflictos en algunos escenarios, por lo que generalmente se recomienda utilizar fullchain.pem.
Para Mosquitto, solo se requerirán los archivos fullchain.pem y privkey.pem.
Ejecución del Broker MQTT
La configuración de Mosquitto ya está preparada para referenciar los certificados emitidos por Let’s Encrypt. Para lanzar el servicio, ejecuta:
justmqtt
Este comando inicia Mosquitto utilizando el archivo de configuración mosquitto.conf, el cual contiene las rutas correctas a los certificados.
Detalles del Certificado
Clave Privada (privkey.pem): Garantiza la identidad segura del servidor.
Cadena Completa (fullchain.pem): Incluye tanto el certificado del servidor como los certificados intermedios necesarios.
Dado que los clientes suelen confiar en las CA de Let’s Encrypt incluidas en sus sistemas operativos, no es necesario proporcionar un certificado CA adicional en el broker.
Renovación del Certificado
Los certificados de Let’s Encrypt tienen una vigencia de 90 días, por lo que es imprescindible renovarlos periódicamente para mantener la seguridad. Para renovar los certificados, puedes usar:
justcertbotrenew# o alternativamente:justcertbot_renew
Tras la renovación, si las rutas en el archivo de configuración de Mosquitto permanecen iguales, el broker utilizará automáticamente el nuevo certificado al reiniciarse o al hacer un reload de la configuración.
Notas
Esta configuración es una prueba de concepto. Para entornos de producción, considera automatizar completamente el proceso de renovación y revisar otras medidas de seguridad adicionales.
Asegúrate de actualizar los registros DNS para que la validación del dominio se realice sin problemas.
Modifica los archivos de configuración únicamente si comprendes las implicaciones de seguridad asociadas.
En este post vamos a explorar la configuración de un bróker MQTT utilizando Mosquitto, implementando seguridad mutua a través de certificados: un certificado auto-firmado para el servidor y certificados específicos para los clientes. Analizaremos paso a paso cómo montar el entorno, partiendo de una configuración mínima que permita el uso tanto de conexiones TCP como de Websockets.
A lo largo del artículo se demostrará de manera detallada el proceso de negociación de la conexión cifrada utilizando OpenSSL como cliente TCP+SSL/TLS, y posteriormente se emplearán los clientes de Mosquitto para suscribirse y publicar mensajes en un tópico de demostración. Además, veremos cómo consumir el servicio mediante un sencillo script en Python y, para cerrar, utilizaremos el cliente EMQ MQTTX desde la consola, que nos permitirá interactuar tanto vía TCP como a través de Websockets.
Este enfoque práctico te ayudará a comprender en profundidad cómo garantizar la seguridad en la comunicación MQTT implementando certificados tanto en el servidor como en los clientes. ¡Comencemos!
Asumciones
Para el desarrollo de este post se asumen los siguientes puntos:
PKI y easy-rsa: Contamos con los conocimientos básicos sobre la gestión de certificados mediante una PKI, tal como se describe en el post Gestión de certificados (PKI) – easy-rsa. Se asume que la PKI ya está desplegada siguiendo las indicaciones de dicho post y que la configuración se encuentra en el fichero vars.
Resolución DNS: Se dispone de un servidor DNS que resuelve los nombres de host dentro de nuestra red privada. Aunque es posible modificar el fichero /etc/hosts para lograrlo, esta práctica se considera menos recomendable en entornos donde se puede optar por una solución DNS adecuada.
Instalación de Mosquitto: Se asume que Mosquitto y sus herramientas/clients están instalados en el sistema operativo que utilizaremos. En este post, todas las demostraciones se llevarán a cabo en Linux Ubuntu 22.04.
Estas asunciones nos permitirán centrarnos en la configuración y uso de certificados en el bróker MQTT sin tener que detallar cada uno de los pasos previos para la creación y administración de la infraestructura de certificados.
Por lo tanto, solo tenemos que crear el certificado para los clientes que vamos a usar. Los del servidor MQTT ya están listos.
# desde la máquina que queramos con easy-rsa instalado./easyrsagen-reqclient.example.tld# se genera fichero mqtt.example.tld.req
Firma de la petición de certificado
Si no se lanzó la petición de certificado (certificate request) desde el mismo PKI, hay que copiarlo a la máquina del PKI e importarlo. No lo olvidemos. Aunque en soluciones domésticas típicamente todo lo movemos dentro de la misma estructura de directorios de la PKI.
# en la PKI:## importamos el certificado, si no se ha hecho la petición desde aquí## se asume que se copió el fichero de certificate request en## /the-path/client.example.tld.req./easyrsaimport-req/the-path/client.example.tld.reqclient.example.tld## esto colocará una copia del fichero .req en la PKI y algunos enlaces.## Se le pide a la PKI que firme el certificado./easyrsasign-reqclientclient.example.tld### esto generará el fichero .crt necesarios para armar el cliente.
Creación y firma de la petición de certificado
En un solo comando, en el caso de hacerlo todo desde la PKI (en un solo servidor) podemos obtener: clave privada, request de certificador y certificado firmado. Este certificado será de tipo cliente.
./easyrsabuild-client-fullclient.example.tld# sin cifrado de la clave privada:./easyrsabuild-client-fullclient.example.tld--no-pass
IMPORTANTE, no tiene sentido hacer este comando si previamente hemos hecho la creación de request, (importación) y firmado.
Si queremos emitir un certificado que sea útil tanto para cliente como para servidor podemos usar:
./easyrsabuild-serverClient-fullclientserver.example.tld# sin cifrado de la clave privada:./easyrsabuild-serverClient-fullclientserver.example.tld--no-pass
Configuración de Mosquitto con certificado servidor y requisito de certificado cliente
Esta configuración es muy sencilla y solo pondrá en marcha un Mosquitto en el puerto TCP/8883 además del puerto WSS/8884.
Para lanzar el servicio, simplemente debemos usar el comando:
mosquitto-cmosquitto.conf
Cuando lancemos el servicio se nos pedirá la passphrase de la clave privada dos veces, una para cada uno de los listerners que hemos puesto la configuración, el TCP y el WSS.
Por otro lado, si se configura use_subject_as_username en true, se empleará el campo completo del sujeto del certificado como nombre de usuario. En el caso de que use_identity_as_username o use_subject_as_username se encuentren desactivados, el cliente deberá autenticarse mediante los métodos habituales, como la verificación a través de password_file. Asimismo, cualquier certificado expedido por las autoridades indicadas en cafile o capath será considerado válido para la conexión, lo que ofrece una mayor flexibilidad en la emisión y comprobación de los certificados de cliente.
Cuando el parámetro require_certificate de Mosquitto está configurado a true, se exige que el cliente presente un certificado válido para poder conectarse satisfactoriamente al servicio MQTT. En este contexto, los parámetros adicionales use_identity_as_username y use_subject_as_username resultan relevantes: si use_identity_as_username se establece en true, se utilizará el Common Name (CN) extraído del certificado del cliente en lugar del nombre de usuario MQTT para el control de acceso, omitiéndose la contraseña, ya que se asume que únicamente los clientes autenticados disponen de certificados válidos.
Negociación de la conexión (OpenSSL s_client)
OpenSSL es la herramienta que hay por debajo de easy-rsa y la librería de referencia para SSL/TLS; además de disponer de herramientas que nos permitirán depurar enlaces de cifrados. Para este caso de uso usaremos openssl s_client que nos va a permitir ver todos los detalles de la negociación SSL/TLS con el servidor de MQTT.
# self-signed fail chechkingopenssls_client\-CAfilecerts/ca.crt\mqtt.example.tld:8883# using my CA, self-signed succesful checkingopenssls_client\-CAfilecerts/ca.crt\--certcerts/client.example.tld.crt\--keycerts/client.example.tld.key\mqtt.example.tld:8883
En el vídeo de demostración puedes ver más detalles de cómo se analiza la negociación entre el servidor y el cliente.
Clientes Mosquitto
Usando mosquitto_sub y mosquitto_pub se demuestra cómo se intercambia tráfico a través de un enlace cifrado. Nada del otro mundo, pero que en entornos cifrados y para evoluciones de este escenario veremos que tiene algunas limitaciones.
Me suscribo al topic llamado topic1 y esperando que se publiquen mensajes en él:
Cuando lancemos los comandos, se nos pedirá la passphrase de la clave privada. Tanto para publicar como para suscribirnos, ya que ambos necesitan acceso al fichero “certs/client.example.tld.key” que esta cifrado con una clave simétrica.
Clientes desarrollados en Python
Se trata de un par de scripts muy sencillos que solo pretenden ilustrar lo sencillo que es especificar nuestra propia CA en la inicialización de la conexión segura con el servidor MQTT.
# se requiere uv, si no lo tienes instalado:curl-LsSfhttps://astral.sh/uv/install.sh|sh# lanzamos el suscriptoruvrunmqtt_sub.py# lanzamos el publicadoruvrunmqtt_pub.py
Clientes MQTTX-cli usando TCP y Websockets
Al lanzar el bróker de MQTT expusimos el endpoint en TCP y el de Websockets, pero no hemos usado el segundo para nada todavía. Así, pues, vamos a aprovechar la potencia del cliente de EMQ llamado MQTTX para repetir las mismas funciones que antes, pero ahora haciendo la suscripción con Websockets y la publicación con TCP.
Este cliente por el moment no soporta protección de cifrado simétrico en la clave privada, así pues primero debemos extraer la clave privada a un nuevo fichero:
# extraer clave privada de fichero cifrado:opensslrsa-inpython_client/certs/client.example.tld.key-outpython_client/certs/client.example.tld.key.raw# para completar el proceso se deberá introducir la clave simétrica# mqttx-cli using dockeraliasmqttx-cli'docker run --rm \ --entrypoint /usr/local/bin/mqttx \ -v ./pki/ca.crt:/tmp/ca.crt \ -v ./python_client/certs/client.example.tld.crt:/tmp/client.example.tld.crt \ -v ./python_client/certs/client.example.tld.key.raw:/tmp/client.example.tld.key \ emqx/mqttx-cli'# suscripciónmqttx-clisub\--ca/tmp/ca.crt\--cert/tmp/client.example.tld.crt\--key/tmp/client.example.tld.key\-hmqtt.example.tld\-p8884-lwss\-ttopic1# publicaciónmqttx-clipub\--ca/tmp/ca.crt\--cert/tmp/client.example.tld.crt\--key/tmp/client.example.tld.key\-hmqtt.example.tld\-p8883-lmqtts\-ttopic1-mmessage1
Se describe cómo montar un bróker de MQTT usando Mosquitto, uno de los servidores más rápidos y sencillos de desplegar. Se va a mostrar el fichero de configuración más sencillo posible para cargar los certificados generados tanto para conexión TCP como Websockets.
Seguidamente, se va a demostrar con todo detalle cómo se negocia la conexión cifrada a través del certificado; esto lo haremos usando OpenSSL como cliente TCP+SSL/TLS; después se usarán los clientes de Mosquitto para suscribirse y publicar mensajes en un topic de demo. Seguidamente, también se mostrará cómo consumir el servicio con un simple código hecho en Python. Para finalizar, el servicio se consumirá con el cliente EMQ MQTTX vía consola que nos va a permitir consumir el servicio vía TCP y también vía Websockets.
Se asume que tenemos una PKI desplegada tal y como se explica en Gestión de certificados (PKI) – easy-rsa. Además se asume que la configuración de la misma está en el fichero vars.
También asumiremos que tenemos un servidor DNS que resuelve, por lo menos, en nuestra red privada. Este paso también podría sustituirse con las modificaciones pertinentes del, /etc/hosts pero considero que es una mala práctica si se puede evitar.
También se asume que tenemos instalado Mosquitto y sus tools/clients en el sistema operativo que vamos a usar. Todas nuestras demostraciones serán en Linux Ubuntu 22.04
Demostración en vídeo
Obtención de los certificados
Creamos petición de certificado
El objetivo es rellenar los campos que va a tener nuestro certificado con la información que identifica a nuestro servicio. El campo más importante es el X.509 DN, porque debe coincidir con al menos uno de los nombres canónicos de la máquina (FQDN). Si no tendremos problemas cuando se conecten los clientes, ya que estos se quejarán de que no somos quienes decimos ser. El principal objetivo de un certificado es asegurar que somos quienes decimos ser.
El Common Name (CN), también conocido como Fully Qualified Domain Name (FQDN), es el valor característico que se almacena dentro del campo DN (Distinguished Name), también conocido como X.509 DN.
# desde la máquina que queramos con easy-rsa instalado./easyrsagen-reqmqtt.example.tld# se genera fichero mqtt.example.tld.req
Firma de la petición de certificado
Si no se lanzó la petición de certificado (certificate request) desde el mismo PKI, hay que copiarlo a la máquina del PKI e importarlo. No lo olvidemos. Aunque en soluciones domésticas típicamente todo lo movemos dentro de la misma estructura de directorios de la PKI.
# en la PKI:## importamos el certificado, si no se ha hecho la petición desde aquí## se asume que se copió el fichero de certificate request en## /the-path/mqtt.example.tld.req./easyrsaimport-req/the-path/mqtt.example.tld.reqmqtt.example.tld## esto colocará una copia del fichero .req en la PKI y algunos enlaces.## Se le pide a la PKI que firme el certificado./easyrsasign-reqservermqtt.example.tld### esto generará el fichero .key y .crt necesarios para armar el servidor.
Creación y firma de la petición de certificado
En un solo comando, en el caso de hacerlo todo desde la PKI (en un solo servidor) podemos obtener: clave privada, request de certificador y certificado firmado. Este certificado será de tipo servidor.
./easyrsabuild-server-fullmqtt.example.tld# sin cifrado de la clave privada:./easyrsabuild-server-fullmqtt.example.tld--no-pass
IMPORTANTE, no tiene sentido hacer este comando si previamente hemos hecho la creación de request, (importación) y firmado.
Configuración de Mosquitto con certificados
Esta configuración es muy sencilla y solo pondrá en marcha un Mosquitto en el puerto TCP/8883 además del puerto WSS/8884.
Para lanzar el servicio, simplemente debemos usar el comando:
mosquitto-cmosquitto.conf
Cuando lancemos el servicio se nos pedirá la passphrase de la clave privada dos veces, una para cada uno de los listerners que hemos puesto la configuración, el TCP y el WSS.
Negociación de la conexión (OpenSSL s_client)
OpenSSL es la herramienta que hay por debajo de easy-rsa y la librería de referencia para SSL/TLS; además de disponer de herramientas que nos permitirán depurar enlaces de cifrados. Para este caso de uso usaremos openssl s_client que nos va a permitir ver todos los detalles de la negociación SSL/TLS con el servidor de MQTT.
# self-signed fail chechkingopenssls_clientmqtt.example.tld:8883# using my CA, self-signed succesful checkingopenssls_client-CAfilecerts/ca.crtmqtt.example.tld:8883
En el vídeo de demostración puedes ver más detalles de cómo se analiza la negociación entre el servidor y el cliente.
Clientes Mosquitto
Usando mosquitto_sub y mosquitto_pub se demuestra cómo se intercambia tráfico a través de un enlace cifrado. Nada del otro mundo, pero que en entornos cifrados y para evoluciones de este escenario veremos que tiene algunas limitaciones.
Me suscribo al topic llamado topic1 y esperando que se publiquen mensajes en él:
Se trata de un par de scripts muy sencillos que solo pretenden ilustrar lo sencillo que es especificar nuestra propia CA en la inicialización de la conexión segura con el servidor MQTT.
# se requiere uv, si no lo tienes instalado:curl-LsSfhttps://astral.sh/uv/install.sh|sh# lanzamos el suscriptoruvrunmqtt_sub.py# lanzamos el publicadoruvrunmqtt_pub.py
Clientes MQTTX-cli usando TCP y Websockets
Al lanzar el bróker de MQTT expusimos el endpoint en TCP y el de Websockets, pero no hemos usado el segundo para nada todavía. Así, pues, vamos a aprovechar la potencia del cliente de EMQ llamado MQTTX para repetir las mismas funciones que antes, pero ahora haciendo la suscripción con Websockets y la publicación con TCP.
# para no tener que instalar mqttx-cli lo usaremos desde Docker:aliasmqttx-cli='docker run -it --rm --entrypoint /usr/local/bin/mqttx -v ./mosquitto/certs/ca.crt:/tmp/ca.crt emqx/mqttx-cli'# suscripciónmqttx-clisub\--ca/tmp/ca.crt-hmqtt.example.tld\-p8884-lwss\-ttopic1# publicaciónmqttx-clipub\--ca/tmp/ca.crt-hmqtt.example.tld\-p8883-lmqtts\-ttopic1-mmessage1
Introducción a la Infraestructura de Clave Pública (PKI)
Una PKI, o Infraestructura de Clave Pública, es un sistema que gestiona certificados digitales y claves para garantizar comunicaciones seguras. Vamos a desglosar los conceptos básicos.
Conceptos Clave
PKI: Es el sistema completo que conecta Certificados de Autoridad (CA), claves y certificados para garantizar la confianza entre entidades.
CA (Certificate Authority): Es el “jefe” de la PKI. Firma y valida certificados, garantizando que son de confianza.
Certificado: Documento digital que incluye una clave pública, información sobre la entidad, y la firma del CA. Es como un pasaporte digital.
Solicitud de Certificado: Es un “borrador” del certificado que una entidad envía al CA para que lo firme.
Par de Claves (Keypair): Un conjunto de dos claves: una pública (para compartir) y otra privada (secreta). Por ejemplo, la pública es como tu dirección de correo y la privada como la contraseña.
¿Qué es un CA y por qué es importante?
El CA es el núcleo de una PKI y su clave privada es extremadamente sensible porque firma todos los certificados. Para protegerla, se recomienda mantenerla en un entorno seguro, como un sistema dedicado o incluso desconectado de la red.
¿Cómo funciona todo esto?
Creación del CA: Se genera un par de claves y la estructura necesaria para gestionar certificados.
Solicitud de Certificado: Un cliente (por ejemplo, un servidor VPN) crea un par de claves y envía su solicitud al CA.
Firma y Certificado: El CA verifica la solicitud y utiliza su clave privada para firmar el certificado, que luego devuelve al cliente.
¿Cómo se verifica un certificado? Ejemplos prácticos
La verificación de certificados varía según el contexto, y quiero explicarlo con dos ejemplos claros: una conexión a una VPN, donde yo tengo un par de claves y un certificado, y una conexión a un banco, donde no necesito un par de claves, solo la confianza en la CA.
Ejemplo 1: Conexión VPN (yo tengo mi par de claves y certificado)
Cuando me conecto a una VPN, tanto el cliente como el servidor necesitan un par de claves (pública y privada) y certificados firmados por la misma CA. El proceso es el siguiente:
Yo genero mi par de claves y solicito un certificado al CA, que verifica mi identidad y firma mi certificado.
Cuando intento conectar al servidor VPN, este me presenta su certificado.
Yo verifico que el certificado del servidor fue firmado por el CA en el que confío.
Luego, envío mi propio certificado al servidor, que hace la misma verificación con su copia del CA.
Si todo es válido, ambos usamos nuestras claves privadas para intercambiar información cifrada y establecer una conexión segura.
Por ejemplo, si trabajo remotamente y necesito acceder a la red de mi empresa, configuro un cliente VPN con mi certificado y claves. El servidor verifica que yo soy quien digo ser y me deja entrar solo si la verificación es correcta.
Ejemplo 2: Conexión a un banco (sin par de claves, solo confianza en la CA)
Cuando accedo a la web de mi banco desde mi navegador, no necesito un par de claves personal. Simplemente, confío en los certificados emitidos por las CA incluidas en la lista de confianza de mi navegador. Así funciona:
El servidor del banco me envía su certificado.
Mi navegador verifica que el certificado fue firmado por una CA en su lista de confianza y que este no está caducado ni revocado.
Si la verificación es exitosa, se establece una conexión segura mediante TLS/SSL.
Durante la conexión, el banco usa su clave privada para demostrar que es legítimo, firmando datos que mi navegador valida con la clave pública incluida en el certificado del banco.
Por ejemplo, cuando accedo a https://mi-banco.com, mi navegador me muestra un candado en la barra de direcciones. Esto significa que ha validado el certificado del banco y ahora la conexión es segura. Aunque yo no tengo claves en este caso, confío en la autoridad que firmó el certificado del banco.
Vamos a crear nuestra propia PKI y la gestión de certificados usando easy-rsa
Easy-RSA es una herramienta poderosa y sencilla para gestionar una infraestructura PKI (Infraestructura de Clave Pública). Con ella puedo emitir certificados para servidores VPN, páginas web, y clientes que necesiten conexiones seguras. Aquí explicaré cómo utilizar Easy-RSA para construir esta infraestructura y cómo interpretar sus resultados.
Importante mencionar que easy-rsa no son más que unos scripts que simplifican el uso de OpenSSL que es la verdadera herramienta que hay por detrás gestionando los certificados, claves y demás.
Obtener easy-rsa:
gitclonehttps://github.com/OpenVPN/easy-rsa.git
Configuración del archivo vars en Easy-RSA
El archivo vars permite configurar parámetros básicos y avanzados antes de iniciar el PKI con init-pki, ahorrando tiempo y garantizando consistencia. Para empezar, copio vars.example a vars y relleno las partes que me interesen, como:
Datos del certificado: País, ciudad, organización, etc.
Claves y algoritmos: Tamaño (2048 bits) y tipo (RSA o EC).
Primero, descargo Easy-RSA desde su repositorio oficial. Como no requiere instalación, simplemente extraigo el archivo comprimido (.tar.gz para Linux/Unix o .zip para Windows) en el directorio que prefiera.
Para comenzar, inicializo el directorio de PKI con:
./easyrsainit-pki
Esto crea una estructura de directorios básica para gestionar los certificados. El directorio pki incluye:
private/: Guarda claves privadas (debe mantenerse muy seguro).
reqs/: Contiene solicitudes de certificados.
issued/: Almacena certificados emitidos.
ca.crt: El certificado de la CA (Autoridad Certificadora).
private/ca.key: La clave privada de la CA, crítica para la seguridad de toda la infraestructura.
Paso 2: Crear la Autoridad Certificadora (CA)
La CA es el corazón de mi PKI. Es quien firma los certificados y garantiza su validez. Creo la CA con:
./easyrsabuild-ca
Durante este proceso, defino un nombre común (Common Name, CN) para identificar mi CA, y se me pedirá configurar una frase de contraseña fuerte para proteger la clave privada (ca.key). Este archivo es extremadamente sensible, y su seguridad es crítica.
El resultado principal de este paso es:
ca.crt: El certificado público de la CA, que compartiré con clientes y servidores para verificar certificados.
Paso 3: Generar claves y solicitudes de certificados
Para que un cliente o servidor VPN funcione, primero genero un par de claves (privada y pública) junto con una solicitud de certificado (CSR). Esto se hace con:
./easyrsagen-req<nombre-del-certificado|FQDN># muy importante usar FQDN (Fully Qualified Domain Names) para evitar# problemas de matching con los hostnames usados en la conexión.
Por ejemplo, para un servidor VPN:
./easyrsagen-reqvpn-server.example.tld
El comando genera dos archivos:
private/<nombre-del-certificado>.key: La clave privada. Este archivo debe permanecer en el servidor o cliente correspondiente y nunca compartirse.
reqs/<nombre-del-certificado>.req: La solicitud de certificado (CSR). Este archivo se envía al CA para ser firmado.
Paso 4: Firmar solicitudes de certificados
Una vez que tengo la solicitud (.req), la importo en el CA y la firmo. Esto se realiza con:
1. Importar la solicitud
# solo hay que hacer este paso si el certificate request # lo hemos copiado de otra máquina. Esto lo coloca en path# para que todo vaya automático, incluidas futuras # renovaciones../easyrsaimport-req/the-path/vpn-server.example.tld.reqvpn-server.example.tld
2. Firmar la solicitud
./easyrsasign-reqservervpn-server.example.tld
Easy-RSA generará un certificado firmado en pki/issued/servidor-vpn.crt. Este archivo es lo que el servidor VPN utiliza para identificarse de forma segura ante sus clientes.
Paso 5: Configuración de un servidor y cliente VPN
Servidor VPN
Para configurar un servidor VPN (como OpenVPN), necesitaré los siguientes archivos generados por Easy-RSA:
Clave privada (private/servidor-vpn.key): Usada por el servidor para encriptar las comunicaciones.
Certificado firmado (issued/servidor-vpn.crt): Garantiza que el servidor es confiable.
Certificado de la CA (ca.crt): certificado y clave pública de nuestra PKI.
Estos archivos se colocan en el directorio de configuración del servidor VPN y se referencian en su configuración.
Cliente VPN
Hay que repetir el paso 4, en este caso una buena práctica es poner como “nombre-del-certificado” el nombre del usuario, o el cliente, que pide el certificado de acceso. En algunos casos de uso, eso permite no tener que pasar por un proceso de autenticación.
Después de generar la petición y haberla importado, como indica la primera parte del paso 5. Hay que ir muy en cuidado con el segundo paso. Al firmar el certificate request hay que hacerlo indicando que su uso será de cliente, no de servidor.
# creamos el certificate request./easyrsagen-reqmi-nombre-de-usuario# importamos el certificado si es necesario en la PKI./easyrsaimport-req/the-path/mi-nombre-de-usuario.reqmi-nombre-de-usuario# firmamos el certificate request indicando el uso como cliente./easyrsasign-reqclientmi-nombre-de-usuario
Después de firmar el certificate-request ya tenemos los ficheros que deberá usar el cliente para conectarse al servidor:
Clave privada (private/mi-nombre-de-usuario.key): Usado por el cliente para encriptar las comunicaciones.
Certificado firmado (issued/mi-nombre-de-usuario.crt): Garantiza que el servidor es confiable.
Certificado de la CA (ca.crt): certificado y clave pública de nuestra PKI.
NOTA:
Cuando se firma un certificado las posibles opciones a seleccionar son:
client – es para TLS client, típicamente usado para usuarios de VPN, o para navegadores Web
server – para TLS server, típicamente servidores Web y servidores VPN.
ca – cuando queremos crear CA (Certificate Authorities) en cascada, esto emite un certificado intermedio. Técnicamente, lo llaman chaining certificate.
serverClient – certificado que serve tanto para cliente como para servidor TLS.
Paso 6: Configuración para servidores web
El proceso es similar para un servidor web (HTTPS). Genero una solicitud de certificado para el dominio del servidor (por ejemplo, mi-servidor.com) y la firmo con la CA. Los archivos necesarios serán:
Clave privada (private/mi-servidor.key): Exclusiva del servidor web.
Certificado firmado (issued/mi-servidor.crt): Identifica al servidor web.
Certificado de la CA (ca.crt): Permite a los navegadores validar la conexión.
Estos archivos se configuran en el servidor web (como Apache o Nginx) para habilitar HTTPs.
Gestión de certificados emitidos, CRL y Validación en Tiempo Real con OCSP
Easy-RSA no solo permite emitir y revocar certificados, sino que también facilita la gestión de la revocación mediante la generación de listas de certificados revocados (CRL) y la implementación de validación en tiempo real a través de OCSP. Cuando se detecta que una clave privada ha sido comprometida o un certificado ya no es necesario, se procede a su revocación:
Revocar un certificado: Utiliza el comando: ./easyrsa revoke <nombre-del-certificado> Esto marca el certificado como revocado dentro de la base de datos de la PKI.
Generar la CRL: Una vez revocados los certificados, es necesario generar una nueva lista de revocación. Esto se realiza con: ./easyrsa gen-crl Este comando genera dos ficheros:
crl.pem: La CRL en formato Base64.
crl.der: La CRL en formato binario. Estos archivos deben publicarse en un servidor accesible para que los clientes puedan descargarlos y comprobar el estado de los certificados.
Aunque la CRL es la solución tradicional para gestionar certificados revocados, presenta limitaciones como el tamaño de la lista y la necesidad de descargarla por completo en cada comprobación. Para solventar estas deficiencias, se puede implementar OCSP (Online Certificate Status Protocol).
OCSP es un protocolo definido en el RFC 2560 que permite a un cliente consultar el estado de un certificado de forma puntual y en tiempo real, sin tener que procesar toda la CRL. Entre sus ventajas destacan:
Información actualizada: Permite obtener el estado de revocación de un certificado al momento de la consulta.
Eficiencia: Reduce el tráfico y la carga de procesamiento en el cliente, ya que se consulta solo el certificado específico.
Privacidad: Evita la exposición de información potencialmente sensible contenida en la CRL.
Escalabilidad: Emplea mecanismos optimizados (a menudo basados en motores de base de datos) para gestionar consultas incluso en entornos con un gran número de certificados.
Implementación de un Servidor OCSP con OpenSSL:
Para poner en marcha un servidor OCSP, utiliza el siguiente comando:
Esta consulta permite verificar de forma inmediata si el certificado está revocado o sigue siendo válido.
Integrar la generación y publicación de CRL con un servidor OCSP proporciona un mecanismo completo para la gestión de certificados emitidos. Mientras que la CRL ofrece una solución tradicional basada en la descarga de una lista completa, OCSP permite a los clientes obtener el estado de un certificado de forma ágil y en tiempo real, optimizando el proceso de validación y reduciendo la carga en la red. Este enfoque combinado asegura que, tanto en entornos de pruebas como en producción, se disponga de mecanismos robustos para mantener la integridad y seguridad de la infraestructura PKI.
Renovar un certificado
Normalmente, poco antes de caducar un certificado se pide su renovación. Esto emitirá otro fichoero de certificado firmado por la CA como el que se emetió la primera vez, pero con una nueva fecha de caducidad:
es buena idea ejecutar el siguiente comando para asegurarse que el viejo certificado queda obsoleto:
./easyrsarevoke-renewed<nombre-del-certificado>
esto nos acaba forzando a generar una nueva lista de certificados revocados. O sea, hay que ejecutar:
./easyrsagen-crl
y en consecuencia distribuir el nuevo fichero CRL.
Conclusión
Easy-RSA simplifica la creación y gestión de una infraestructura PKI, lo que me permite emitir y administrar certificados para VPNs y servidores web. Sus outputs, como las claves privadas, certificados firmados, y el certificado de la CA, son los componentes esenciales para garantizar conexiones seguras. Con esta herramienta, puedo construir mi propia red confiable para asegurar tanto servidores como clientes en diferentes escenarios.
The architecture for this setup is illustrated below:
Install udp2raw, Wireguard and generate keys
cd/tmpwgethttps://github.com/wangyu-/udp2raw/releases/download/20230206.0/udp2raw_binaries.tar.gztarxvfzudp2raw_binaries.tar.gzcpudp2raw_amd64/usr/local/bin/udp2rawrmudp2raw*# based on Ubuntuaptinstallwireguard# we'll work on /etc/wireguardcd/etc/wireguard# generate privatekeywggenkey|sudotee/etc/wireguard/private.keysudochmodgo=/etc/wireguard/private.key# obtain public keysudocat/etc/wireguard/private.key|wgpubkey|sudotee/etc/wireguard/public.key
When eveything is installend and configured, just run in all endpoints next commands:
sudowg-quickupwg0# for status check:wg# udp2raw logs at:tail-f/var/log/udp2raw.log# enable automatic wireward service in Ubuntusudosystemctlenablewg-quick@wg0.service# start and stop service like alwayssudosystemctlstartwg-quick@wg0.servicesudosystemctlstopwg-quick@wg0.servicesudosystemctlstatuswg-quick@wg0.service
Configuration Files
Endpoint A /etc/wireguard/wg0
# local settings for Endpoint A[Interface]PrivateKey=WMUerfcUpSxUlOp1UmaS2uwelnk8AxhAFrlIWpjheWM=Address=192.168.111.1/24ListenPort=51822# receive wg through udp2rawMTU=1342PreUp=udp2raw-s-l167.99.130.97:55055-r127.0.0.1:51822-k"The2password."-a>/var/log/udp2raw.log2>&1&PostDown=killalludp2raw||true# Enable NAT for traffic forwarding (corporate and fallback internet access)PreUp=echo1>/proc/sys/net/ipv4/ip_forward||truePreUp=iptables-tnat-IPOSTROUTING-oeth0-jMASQUERADE||truePreDown=iptables-tnat-DPOSTROUTING-oeth0-jMASQUERADE||true# remote settings for Endpoint B[Peer]PublicKey=XWl8HeAinHlAZTvaCXDlmO9n/CQLg5qH8jmtROK4jBg=AllowedIPs=192.168.111.2/32PersistentKeepalive=120# remote settings for Endpoint C[Peer]PublicKey=I+gi8l9QRe00W8pTpp8CSoIabz/RXXQXwquXj7eKNwU=AllowedIPs=192.168.111.3/32PersistentKeepalive=120
Endpoint B /etc/wireguard/wg0
# Endpoint B[Interface]PrivateKey=+BB3NI2SUYeKcRoPrZE2+Ot5KnLZJBycPzJ17kfbn34=Address=192.168.111.2/24# Route configuration for public IPPreUp=iproutedeldefault||truePreUp=iprouteadd167.99.130.97via10.2.0.1deveth0||truePostDown=iproutedel167.99.130.97via10.2.0.1deveth0||truePostDown=iprouteadddefaultvia10.2.0.1||trueMTU=1342PreUp=udp2raw-c-l127.0.0.1:50001-r167.99.130.97:55055-k"The2password."-a>/var/log/udp2raw.log2>&1&PostDown=killalludp2raw||true# Endpoint A[Peer]PublicKey=z73wM1b7fhMRA8fmeQw4FntRvgJ9JwTdsQHssXHg3DE=Endpoint=127.0.0.1:50001AllowedIPs=0.0.0.0/0PersistentKeepalive=120
Endpoint C /etc/wireguard/wg0
# Endpoint C[Interface]PrivateKey=YCGzsfeed8QumpfE8bdWRheMzBiUsTB7vXj0YVOQQX0=Address=192.168.111.3/24# Route configuration for public IPPreUp=iproutedeldefault||truePreUp=iprouteadd167.99.130.97via10.2.0.1deveth0||truePostDown=iproutedel167.99.130.97via10.2.0.1deveth0||truePostDown=iprouteadddefaultvia10.2.0.1||trueMTU=1342PreUp=udp2raw-c-l127.0.0.1:50001-r167.99.130.97:55055-k"The2password."-a>/var/log/udp2raw.log2>&1&PostDown=killalludp2raw||true# Endpoint A[Peer]PublicKey=z73wM1b7fhMRA8fmeQw4FntRvgJ9JwTdsQHssXHg3DE=Endpoint=127.0.0.1:50001AllowedIPs=0.0.0.0/0PersistentKeepalive=120