oriolrius.cat

Des del 2000 compartiendo sobre…

Tag: tcpdump

Sniffing Network Traffic in Docker Containers: Leveraging Host’s tcpdump, tcpflow, and more

Reading time: 2 – 3 minutes

In a Dockerized environment, one often encounters the need to monitor network traffic. However, one might not always wish to install sniffing tools within the container itself. By diving into the network namespace of the container, one can employ the host’s network packages such as tcpdump, tcpflow, and others, to achieve this without augmenting the container’s environment.

Step 1: Dive into the Container’s Network Namespace

Fetch the SandboxKey, which denotes the container’s network namespace:

SANDBOX_KEY=$(docker inspect <CONTAINER_ID> --format '{{ .NetworkSettings.SandboxKey }}')

Enter the container’s network namespace:

sudo nsenter --net=$SANDBOX_KEY

Step 2: Sniff Network Traffic Using Host’s Tools

Having entered the namespace, you can now utilize the host’s packages.

Using tcpdump:

tcpdump -i <INTERFACE_NAME> -w <OUTPUT_FILE.pcap>

Replace <INTERFACE_NAME> as per requirement (typically eth0 for Docker containers). For tcpdump, <OUTPUT_FILE.pcap> is the desired capture file. For tcpflow, <OUTPUT_DIRECTORY> is where the captured streams will be saved.

Conclusion

By navigating into a Docker container’s network namespace, you can readily use the network tools installed on the host system. This strategy circumvents the need to pollute the container with additional packages, upholding the principle of container immutability.
Network traffic sniffing: tcpdump on Linux + Wireshark on Windows

Reading time: 2 – 2 minutes

From the Windows box using the CLI console (cmd):

ssh USER@HOST "tcpdump -s 0 -U -n -w - -i NETIF FILTER" | "c:\Program Files\Wireshark\Wireshark.exe" -k -i -

# USER - remote user of the linux box
# HOST - host address of the remote linux box
# NETIF - network interface to snif in the remote linux box
# FILTER - (optional) rules for filtering traffic to capture

Use case:

C:\Windows\System32\OpenSSH>ssh root@192.168.4.74 "tcpdump -s 0 -U -n -w - -i eno2 udp and not port 53" | "c:\Program Files\Wireshark\Wireshark.exe" -k -i -

Let me present a rare use case of this useful trick. I use a QNAP NAS as a gateway in my home network, where I have 5 NICs. So it’s really useful to snif traffic remotly but I have no tcpdump packet in the system. What I did is use tcpdump as Docker container and finally the commands is like that.

# sniffing SIP traffic (port 5060) on interface eth0
# remote linux host (QNAP NAS) use SSH port 55222
# docker container is created and when work is done is removed
C:\Windows\System32\OpenSSH>ssh -p 55222 admin@10.2.0.1 "cd /share/Container/tcpdump && docker run --rm --net=host corfr/tcpdump -s 0 -U -n -w - -i eth0 not port 22 and port 5060" | "c:\Program Files\Wireshark\Wireshark.exe" -k -i -

Sniffing traffic in a Linux box and streaming in real-time to Wireshark on Windows

Reading time: 1 – 2 minutes

Sniffing and inspect complex protocols on “tcpdump” is usually painful. Of course, “tcpflow” is a very useful tool but is not always enough to sniff in a console. Wireshark is always a better option when it’s time to debug and troubleshooting communication problems.

But it’s not always easy to plug a Network TAP where you want to sniff. If at that point we have a Linux box with “ssh” and “tcpdump”. An interesting option is stream sniffed traffic to another box with Wireshark and dissect packet octets in their layers, fields, etc.

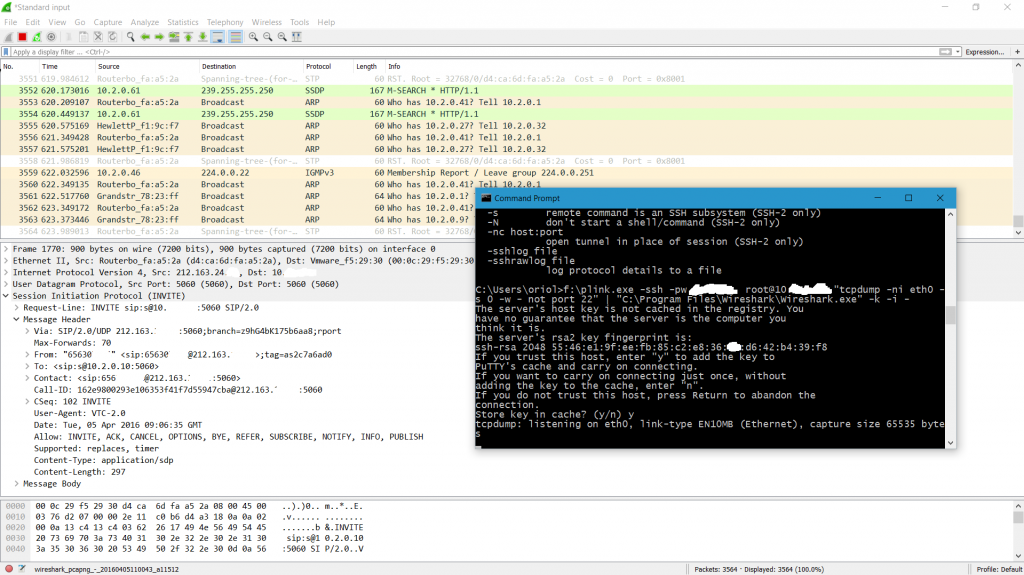
When Wireshark box is based on Windows you need “plink.exe“, and you can do thinks like that:

plink.exe -ssh -pw LINUX_BOX_PASSWORD root@LINUX_BOX_IP "tcpdump -n -i INTERFACE_TO_SNIFF -s 0 -w - not port 22" | "%PATH_TO_WIRESHARK\Wireshark.exe" -k -i -

Next you have a screenshot with a real life example of that:

tcpdump_streams_to_wireshark_secure

sslsnoop – hacking OpenSSH

Reading time: < 1 minute Using sslsnoop you can dump SSH keys used in a session and decode ciphered traffic. Supported algorithms are: aes128-ctr, aes192-ctr, aes256-ctr, blowfish-cbc, cast128-cbc. Basic sslsnoop information:

 $ sudo sslsnoop # try ssh, sshd and ssh-agent… for various things
 $ sudo sslsnoop-openssh live `pgrep ssh` # dumps SSH decrypted traffic in outputs/
 $ sudo sslsnoop-openssh offline –help # dumps SSH decrypted traffic in outputs/ from a pcap file
 $ sudo sslsnoop-openssl `pgrep ssh-agent` # dumps RSA and DSA keys

Take a look into the project in sslsnoop github page.

ssldump depuració de tràfic xifrat

Reading time: 2 – 2 minutes

Tothom coneix el TCPdump i fins hi tot hi ha gent com jo que l’usem a diari, de fet, no fa massa temps  vaig re-descobrir el TCPflow (ja l’havia descobert abans, però vaig cometre el gran error d’oblidar-lo). Doncs bé, el problema d’aquestes eines és que són molt útils per tràfic sense xifrar però quan es tracta de tràfic xifrat amb SSL/TLS com ara HTTPs o d’altres protocols que viatgen xifrats i volem saber perquè no funcionen hem de recorrer a eines com el ssldump.

SSLdump permet seguir el fluxe de les conexions TCP xifrades amb SSLv3/TLS. Obviament per aconseguir desxifrar el contingut de l’enllaç hem de facilitar-li els certificats corresponents a l’eina. Però no només ens permet depurar a nivell de dades que corren per TCP sinó que també ens dona informació del propi protocol de xifrat descrita de forma humana. O sigui, que podem saber si el problema de l’enllaç és produeix durant el procés de handshake, ChangeCipherSpec o dins del protocol.

El que jo feia fins ara per poder analitzar el contingut d’un protocol que viatge xifrat és ajudar-me de l’eina sslproxy. La qual feia de bouncer al servidor de protocol o al client, així doncs obtenia un tram de la conexió que no anava xifrat i a través del tcpflow o el tcpdump podia obtenir el tràfic en clar. La tècnica és enginyosa i útil però ferragosa en comparació al ssldump.

tcpflow: mirant streams tcp en un moment

Reading time: 1 – 2 minutes

Fins ara per poder seguir un protocol dins del enllaç TCP, o sigui els missatges de la capa 5, sempre acabava capturant-lo amb el wireshark o en el seu defecte amb el tcpdump generava un fitxer .cap que després obria al wireshark i a través d’una funció tan simple com el Follow TCP stream em montava la sessió de capa d’aplciació que podia seguir de forma ben còmode. El gran descobriment que vaig fer l’altre dia és el tcpflow una eina la mar de simple i lleugera que com no podia ser d’altre forma usa les llibreries libpcap, le mateixes que el tcpdump i el wireshark per mostrar-nos de forma completament visual i simple a través de la consola o contra un fitxer el contingut de la sessió TCP. Espero que li tregueu tan profit com jo a l’eina.

nota recordatori de tcpdump

Reading time: < 1 minute

Mai recordo la sintaxis per filtrar amb el tcpdump quan em fa falta, així doncs:

tcpdump -i eth0 -n tcp port 1500
tcpdump host 10.0.1.12
tcpdump icmp and host 10.0.1.12
tcpdump -i eth1 host 10.0.1.11 and host 10.0.1.12

Algunes expresions per l’ethereal/wireshark també usables amb el tcpdump, és clar:

ip.dst == 10.0.1.50 && frame.pkt_len > 400
ip.addr == 10.0.1.12 && icmp && frame.number > 15 && frame.number < 30
ip.addr == 10.0.1.12 && tcp.port == 23
host 10.0.1.12 and tcp port 23