MQTT Broker (Mosquitto) con certificado servidor (self-signed)
Serie
- Gestión de certificados (PKI) – easy-rsa
- MQTT Broker (Mosquitto) con certificado servidor (self-signed)
- MQTT Broker (Mosquitto) con certificado servidor (self-signed) y certificado en los clientes
- MQTT Broker (Mosquitto) con certificado servidor (Let’s Encrypt)
- Formatos de Certificados: PEM, DER y PKCS#12 y Manipulación de Claves Privadas
Descripción del escenario
Se describe cómo montar un bróker de MQTT usando Mosquitto, uno de los servidores más rápidos y sencillos de desplegar. Se va a mostrar el fichero de configuración más sencillo posible para cargar los certificados generados tanto para conexión TCP como Websockets.
Seguidamente, se va a demostrar con todo detalle cómo se negocia la conexión cifrada a través del certificado; esto lo haremos usando OpenSSL como cliente TCP+SSL/TLS; después se usarán los clientes de Mosquitto para suscribirse y publicar mensajes en un topic de demo. Seguidamente, también se mostrará cómo consumir el servicio con un simple código hecho en Python. Para finalizar, el servicio se consumirá con el cliente EMQ MQTTX vía consola que nos va a permitir consumir el servicio vía TCP y también vía Websockets.
Asumciones
- Tenemos los conceptos básicos descritos descritos en el post Gestión de certificados (PKI) – easy-rsa.
- Se asume que tenemos una PKI desplegada tal y como se explica en Gestión de certificados (PKI) – easy-rsa. Además se asume que la configuración de la misma está en el fichero
vars.
- También asumiremos que tenemos un servidor DNS que resuelve, por lo menos, en nuestra red privada. Este paso también podría sustituirse con las modificaciones pertinentes del,
/etc/hostspero considero que es una mala práctica si se puede evitar.
- También se asume que tenemos instalado Mosquitto y sus tools/clients en el sistema operativo que vamos a usar. Todas nuestras demostraciones serán en Linux Ubuntu 22.04
Demostración en vídeo
Obtención de los certificados
Creamos petición de certificado
El objetivo es rellenar los campos que va a tener nuestro certificado con la información que identifica a nuestro servicio. El campo más importante es el X.509 DN, porque debe coincidir con al menos uno de los nombres canónicos de la máquina (FQDN). Si no tendremos problemas cuando se conecten los clientes, ya que estos se quejarán de que no somos quienes decimos ser. El principal objetivo de un certificado es asegurar que somos quienes decimos ser.
El Common Name (CN), también conocido como Fully Qualified Domain Name (FQDN), es el valor característico que se almacena dentro del campo DN (Distinguished Name), también conocido como X.509 DN.
# desde la máquina que queramos con easy-rsa instalado
./easyrsa gen-req mqtt.example.tld
# se genera fichero mqtt.example.tld.req
Firma de la petición de certificado
Si no se lanzó la petición de certificado (certificate request) desde el mismo PKI, hay que copiarlo a la máquina del PKI e importarlo. No lo olvidemos. Aunque en soluciones domésticas típicamente todo lo movemos dentro de la misma estructura de directorios de la PKI.
# en la PKI:
## importamos el certificado, si no se ha hecho la petición desde aquí
## se asume que se copió el fichero de certificate request en
## /the-path/mqtt.example.tld.req
./easyrsa import-req /the-path/mqtt.example.tld.req mqtt.example.tld
## esto colocará una copia del fichero .req en la PKI y algunos enlaces.

## Se le pide a la PKI que firme el certificado
./easyrsa sign-req server mqtt.example.tld
### esto generará el fichero .key y .crt necesarios para armar el servidor.
Creación y firma de la petición de certificado
En un solo comando, en el caso de hacerlo todo desde la PKI (en un solo servidor) podemos obtener: clave privada, request de certificador y certificado firmado. Este certificado será de tipo servidor.
./easyrsa build-server-full mqtt.example.tld

# sin cifrado de la clave privada:
./easyrsa build-server-full mqtt.example.tld --no-passIMPORTANTE, no tiene sentido hacer este comando si previamente hemos hecho la creación de request, (importación) y firmado.
Configuración de Mosquitto con certificados
Esta configuración es muy sencilla y solo pondrá en marcha un Mosquitto en el puerto TCP/8883 además del puerto WSS/8884.
mosquitto.conf
# mqtt secure
listener 8883 0.0.0.0
cafile certs/ca.crt
keyfile certs/mqtt.example.tld.key
certfile certs/mqtt.example.tld.crt
crlfile certs/pki.example.tld.crl
allow_anonymous true
require_certificate false

# websockets secure
listener 8884 0.0.0.0
protocol websockets
cafile certs/ca.crt
keyfile certs/mqtt.example.tld.key
certfile certs/mqtt.example.tld.crt
crlfile certs/pki.example.tld.crl
require_certificate false
Para lanzar el servicio, simplemente debemos usar el comando:
mosquitto -c mosquitto.confCuando lancemos el servicio se nos pedirá la passphrase de la clave privada dos veces, una para cada uno de los listerners que hemos puesto la configuración, el TCP y el WSS.
Negociación de la conexión (OpenSSL s_client)
OpenSSL es la herramienta que hay por debajo de easy-rsa y la librería de referencia para SSL/TLS; además de disponer de herramientas que nos permitirán depurar enlaces de cifrados. Para este caso de uso usaremos openssl s_client que nos va a permitir ver todos los detalles de la negociación SSL/TLS con el servidor de MQTT.
# self-signed fail chechking
openssl s_client mqtt.example.tld:8883
# using my CA, self-signed succesful checking
openssl s_client -CAfile certs/ca.crt mqtt.example.tld:8883
En el vídeo de demostración puedes ver más detalles de cómo se analiza la negociación entre el servidor y el cliente.
Clientes Mosquitto
Usando mosquitto_sub y mosquitto_pub se demuestra cómo se intercambia tráfico a través de un enlace cifrado. Nada del otro mundo, pero que en entornos cifrados y para evoluciones de este escenario veremos que tiene algunas limitaciones.
Me suscribo al topic llamado topic1 y esperando que se publiquen mensajes en él:
mosquitto_sub --cafile pki/ca.crt -d -h mqtt.example.tld -p 8883 -t topic1 -vPublico un mensaje en el topic con el contenido: value1
mosquitto_pub --cafile pki/ca.crt -d -h mqtt.example.tld -p 8883 -t topic1 -m message1Clientes desarrollados en Python
Se trata de un par de scripts muy sencillos que solo pretenden ilustrar lo sencillo que es especificar nuestra propia CA en la inicialización de la conexión segura con el servidor MQTT.
# se requiere uv, si no lo tienes instalado:
curl -LsSf https://astral.sh/uv/install.sh | sh
# lanzamos el suscriptor
uv run mqtt_sub.py
# lanzamos el publicador
uv run mqtt_pub.py
Clientes MQTTX-cli usando TCP y Websockets
Al lanzar el bróker de MQTT expusimos el endpoint en TCP y el de Websockets, pero no hemos usado el segundo para nada todavía. Así, pues, vamos a aprovechar la potencia del cliente de EMQ llamado MQTTX para repetir las mismas funciones que antes, pero ahora haciendo la suscripción con Websockets y la publicación con TCP.
# para no tener que instalar mqttx-cli lo usaremos desde Docker:
alias mqttx-cli='docker run -it --rm --entrypoint /usr/local/bin/mqttx -v ./mosquitto/certs/ca.crt:/tmp/ca.crt emqx/mqttx-cli'

# suscripción
mqttx-cli sub \
  --ca /tmp/ca.crt
  -h mqtt.example.tld \
  -p 8884 -l wss \
  -t topic1

# publicación
mqttx-cli pub \
  --ca /tmp/ca.crt
  -h mqtt.example.tld \
  -p 8883 -l mqtts \
  -t topic1 -m message1
Referencias
- Repositorio github/kiss-mqtt-client-private-key
- https://mqttx.app/
- https://mqttx.app/docs/cli
- Creating and Using Client Certificates with MQTT and Mosquitto
- Using A Lets Encrypt Certificate on Mosquitto
- SSL and SSL Certificates Explained For Beginners
- Mosquitto.conf man
- How to Configure MQTT over WebSockets with Mosquitto Broker
- Getting the Client’s Real IP When Using the NGINX Reverse Proxy for EMQX
ffmpeg, converting 5K video to 1080p (FHD)
Just a reminder:
ffmpeg -hwaccel cuda -hwaccel_output_format cuda -i "input_file.mp4" -c:a copy -vf "scale_cuda=-2:1080" -c:v h264_nvenc "output_file.mp4"Gestión de certificados (PKI) – easy-rsa
Serie
- Gestión de certificados (PKI) – easy-rsa
- MQTT Broker (Mosquitto) con certificado servidor (self-signed)
- MQTT Broker (Mosquitto) con certificado servidor (self-signed) y certificado en los clientes
- MQTT Broker (Mosquitto) con certificado servidor (Let’s Encrypt)
- Formatos de Certificados: PEM, DER y PKCS#12 y Manipulación de Claves Privadas
Introducción a la Infraestructura de Clave Pública (PKI)
Una PKI, o Infraestructura de Clave Pública, es un sistema que gestiona certificados digitales y claves para garantizar comunicaciones seguras. Vamos a desglosar los conceptos básicos.
Conceptos Clave
- PKI: Es el sistema completo que conecta Certificados de Autoridad (CA), claves y certificados para garantizar la confianza entre entidades.
- CA (Certificate Authority): Es el “jefe” de la PKI. Firma y valida certificados, garantizando que son de confianza.
- Certificado: Documento digital que incluye una clave pública, información sobre la entidad, y la firma del CA. Es como un pasaporte digital.
- Solicitud de Certificado: Es un “borrador” del certificado que una entidad envía al CA para que lo firme.
- Par de Claves (Keypair): Un conjunto de dos claves: una pública (para compartir) y otra privada (secreta). Por ejemplo, la pública es como tu dirección de correo y la privada como la contraseña.
¿Qué es un CA y por qué es importante?
El CA es el núcleo de una PKI y su clave privada es extremadamente sensible porque firma todos los certificados. Para protegerla, se recomienda mantenerla en un entorno seguro, como un sistema dedicado o incluso desconectado de la red.
¿Cómo funciona todo esto?
- Creación del CA: Se genera un par de claves y la estructura necesaria para gestionar certificados.
- Solicitud de Certificado: Un cliente (por ejemplo, un servidor VPN) crea un par de claves y envía su solicitud al CA.
- Firma y Certificado: El CA verifica la solicitud y utiliza su clave privada para firmar el certificado, que luego devuelve al cliente.
¿Cómo se verifica un certificado? Ejemplos prácticos
La verificación de certificados varía según el contexto, y quiero explicarlo con dos ejemplos claros: una conexión a una VPN, donde yo tengo un par de claves y un certificado, y una conexión a un banco, donde no necesito un par de claves, solo la confianza en la CA.
Ejemplo 1: Conexión VPN (yo tengo mi par de claves y certificado)
Cuando me conecto a una VPN, tanto el cliente como el servidor necesitan un par de claves (pública y privada) y certificados firmados por la misma CA. El proceso es el siguiente:
- Yo genero mi par de claves y solicito un certificado al CA, que verifica mi identidad y firma mi certificado.
- Cuando intento conectar al servidor VPN, este me presenta su certificado.
- Yo verifico que el certificado del servidor fue firmado por el CA en el que confío.
- Luego, envío mi propio certificado al servidor, que hace la misma verificación con su copia del CA.
- Si todo es válido, ambos usamos nuestras claves privadas para intercambiar información cifrada y establecer una conexión segura.
Por ejemplo, si trabajo remotamente y necesito acceder a la red de mi empresa, configuro un cliente VPN con mi certificado y claves. El servidor verifica que yo soy quien digo ser y me deja entrar solo si la verificación es correcta.
Ejemplo 2: Conexión a un banco (sin par de claves, solo confianza en la CA)
Cuando accedo a la web de mi banco desde mi navegador, no necesito un par de claves personal. Simplemente, confío en los certificados emitidos por las CA incluidas en la lista de confianza de mi navegador. Así funciona:
- El servidor del banco me envía su certificado.
- Mi navegador verifica que el certificado fue firmado por una CA en su lista de confianza y que este no está caducado ni revocado.
- Si la verificación es exitosa, se establece una conexión segura mediante TLS/SSL.
- Durante la conexión, el banco usa su clave privada para demostrar que es legítimo, firmando datos que mi navegador valida con la clave pública incluida en el certificado del banco.
Por ejemplo, cuando accedo a https://mi-banco.com, mi navegador me muestra un candado en la barra de direcciones. Esto significa que ha validado el certificado del banco y ahora la conexión es segura. Aunque yo no tengo claves en este caso, confío en la autoridad que firmó el certificado del banco.
Vamos a crear nuestra propia PKI y la gestión de certificados usando easy-rsa
Easy-RSA es una herramienta poderosa y sencilla para gestionar una infraestructura PKI (Infraestructura de Clave Pública). Con ella puedo emitir certificados para servidores VPN, páginas web, y clientes que necesiten conexiones seguras. Aquí explicaré cómo utilizar Easy-RSA para construir esta infraestructura y cómo interpretar sus resultados.
Importante mencionar que easy-rsa no son más que unos scripts que simplifican el uso de OpenSSL que es la verdadera herramienta que hay por detrás gestionando los certificados, claves y demás.
Obtener easy-rsa:
git clone https://github.com/OpenVPN/easy-rsa.gitConfiguración del archivo vars en Easy-RSA
El archivo vars permite configurar parámetros básicos y avanzados antes de iniciar el PKI con init-pki, ahorrando tiempo y garantizando consistencia. Para empezar, copio vars.example a vars y relleno las partes que me interesen, como:
- Datos del certificado: País, ciudad, organización, etc.
- Claves y algoritmos: Tamaño (2048 bits) y tipo (RSA o EC).
- Duración: Expiración de la CA y certificados.
set_var EASYRSA_REQ_COUNTRY "ES"
set_var EASYRSA_REQ_ORG "MiEmpresa"
set_var EASYRSA_KEY_SIZE 2048
set_var EASYRSA_CA_EXPIRE 3650
set_var EASYRSA_CERT_EXPIRE 825
Paso 1: Preparar Easy-RSA
Primero, descargo Easy-RSA desde su repositorio oficial. Como no requiere instalación, simplemente extraigo el archivo comprimido (.tar.gz para Linux/Unix o .zip para Windows) en el directorio que prefiera.
Para comenzar, inicializo el directorio de PKI con:
./easyrsa init-pkiEsto crea una estructura de directorios básica para gestionar los certificados. El directorio pki incluye:
private/: Guarda claves privadas (debe mantenerse muy seguro).reqs/: Contiene solicitudes de certificados.issued/: Almacena certificados emitidos.ca.crt: El certificado de la CA (Autoridad Certificadora).private/ca.key: La clave privada de la CA, crítica para la seguridad de toda la infraestructura.
Paso 2: Crear la Autoridad Certificadora (CA)
La CA es el corazón de mi PKI. Es quien firma los certificados y garantiza su validez. Creo la CA con:
./easyrsa build-caDurante este proceso, defino un nombre común (Common Name, CN) para identificar mi CA, y se me pedirá configurar una frase de contraseña fuerte para proteger la clave privada (ca.key). Este archivo es extremadamente sensible, y su seguridad es crítica.
El resultado principal de este paso es:
ca.crt: El certificado público de la CA, que compartiré con clientes y servidores para verificar certificados.
Paso 3: Generar claves y solicitudes de certificados
Para que un cliente o servidor VPN funcione, primero genero un par de claves (privada y pública) junto con una solicitud de certificado (CSR). Esto se hace con:
./easyrsa gen-req <nombre-del-certificado|FQDN>
# muy importante usar FQDN (Fully Qualified Domain Names) para evitar
# problemas de matching con los hostnames usados en la conexión.
Por ejemplo, para un servidor VPN:
./easyrsa gen-req vpn-server.example.tldEl comando genera dos archivos:
private/<nombre-del-certificado>.key: La clave privada. Este archivo debe permanecer en el servidor o cliente correspondiente y nunca compartirse.reqs/<nombre-del-certificado>.req: La solicitud de certificado (CSR). Este archivo se envía al CA para ser firmado.
Paso 4: Firmar solicitudes de certificados
Una vez que tengo la solicitud (.req), la importo en el CA y la firmo. Esto se realiza con:
1. Importar la solicitud
# solo hay que hacer este paso si el certificate request
# lo hemos copiado de otra máquina. Esto lo coloca en path
# para que todo vaya automático, incluidas futuras
# renovaciones.
./easyrsa import-req /the-path/vpn-server.example.tld.req vpn-server.example.tld
2. Firmar la solicitud
./easyrsa sign-req server vpn-server.example.tldEasy-RSA generará un certificado firmado en pki/issued/servidor-vpn.crt. Este archivo es lo que el servidor VPN utiliza para identificarse de forma segura ante sus clientes.
Paso 5: Configuración de un servidor y cliente VPN
Servidor VPN
Para configurar un servidor VPN (como OpenVPN), necesitaré los siguientes archivos generados por Easy-RSA:
- Clave privada (
private/servidor-vpn.key): Usada por el servidor para encriptar las comunicaciones. - Certificado firmado (
issued/servidor-vpn.crt): Garantiza que el servidor es confiable. - Certificado de la CA (
ca.crt): certificado y clave pública de nuestra PKI.
Estos archivos se colocan en el directorio de configuración del servidor VPN y se referencian en su configuración.
Cliente VPN
Hay que repetir el paso 4, en este caso una buena práctica es poner como “nombre-del-certificado” el nombre del usuario, o el cliente, que pide el certificado de acceso. En algunos casos de uso, eso permite no tener que pasar por un proceso de autenticación.
Después de generar la petición y haberla importado, como indica la primera parte del paso 5. Hay que ir muy en cuidado con el segundo paso. Al firmar el certificate request hay que hacerlo indicando que su uso será de cliente, no de servidor.
# creamos el certificate request
./easyrsa gen-req mi-nombre-de-usuario

# importamos el certificado si es necesario en la PKI
./easyrsa import-req /the-path/mi-nombre-de-usuario.req mi-nombre-de-usuario

# firmamos el certificate request indicando el uso como cliente
./easyrsa sign-req client mi-nombre-de-usuario
Después de firmar el certificate-request ya tenemos los ficheros que deberá usar el cliente para conectarse al servidor:
- Clave privada (
private/mi-nombre-de-usuario.key): Usado por el cliente para encriptar las comunicaciones. - Certificado firmado (
issued/mi-nombre-de-usuario.crt): Garantiza que el servidor es confiable. - Certificado de la CA (
ca.crt): certificado y clave pública de nuestra PKI.
NOTA:
Cuando se firma un certificado las posibles opciones a seleccionar son:
client– es para TLS client, típicamente usado para usuarios de VPN, o para navegadores Webserver– para TLS server, típicamente servidores Web y servidores VPN.ca– cuando queremos crear CA (Certificate Authorities) en cascada, esto emite un certificado intermedio. Técnicamente, lo llaman chaining certificate.serverClient– certificado que serve tanto para cliente como para servidor TLS.
Paso 6: Configuración para servidores web
El proceso es similar para un servidor web (HTTPS). Genero una solicitud de certificado para el dominio del servidor (por ejemplo, mi-servidor.com) y la firmo con la CA. Los archivos necesarios serán:
- Clave privada (
private/mi-servidor.key): Exclusiva del servidor web. - Certificado firmado (
issued/mi-servidor.crt): Identifica al servidor web. - Certificado de la CA (
ca.crt): Permite a los navegadores validar la conexión.
Estos archivos se configuran en el servidor web (como Apache o Nginx) para habilitar HTTPs.
Gestión de certificados emitidos, CRL y Validación en Tiempo Real con OCSP
Easy-RSA no solo permite emitir y revocar certificados, sino que también facilita la gestión de la revocación mediante la generación de listas de certificados revocados (CRL) y la implementación de validación en tiempo real a través de OCSP. Cuando se detecta que una clave privada ha sido comprometida o un certificado ya no es necesario, se procede a su revocación:
- Revocar un certificado:
Utiliza el comando:./easyrsa revoke <nombre-del-certificado>Esto marca el certificado como revocado dentro de la base de datos de la PKI. - Generar la CRL:
Una vez revocados los certificados, es necesario generar una nueva lista de revocación. Esto se realiza con:./easyrsa gen-crlEste comando genera dos ficheros:- crl.pem: La CRL en formato Base64.
- crl.der: La CRL en formato binario.
Estos archivos deben publicarse en un servidor accesible para que los clientes puedan descargarlos y comprobar el estado de los certificados.
Aunque la CRL es la solución tradicional para gestionar certificados revocados, presenta limitaciones como el tamaño de la lista y la necesidad de descargarla por completo en cada comprobación. Para solventar estas deficiencias, se puede implementar OCSP (Online Certificate Status Protocol).
OCSP es un protocolo definido en el RFC 2560 que permite a un cliente consultar el estado de un certificado de forma puntual y en tiempo real, sin tener que procesar toda la CRL. Entre sus ventajas destacan:
- Información actualizada: Permite obtener el estado de revocación de un certificado al momento de la consulta.
- Eficiencia: Reduce el tráfico y la carga de procesamiento en el cliente, ya que se consulta solo el certificado específico.
- Privacidad: Evita la exposición de información potencialmente sensible contenida en la CRL.
- Escalabilidad: Emplea mecanismos optimizados (a menudo basados en motores de base de datos) para gestionar consultas incluso en entornos con un gran número de certificados.
Implementación de un Servidor OCSP con OpenSSL:
Para poner en marcha un servidor OCSP, utiliza el siguiente comando:
openssl ocsp -index /ruta/a/tu/index.txt -port 2560 -ignore_err -rsigner /ruta/a/tu/ocsp.crt -rkey /ruta/a/tu/ocsp.key -CA /ruta/a/tu/ca.crt -text -out /ruta/a/tu/log_ocsp.txt &Donde:
-indexindica el archivo que contiene el índice de certificados emitidos.-portdefine el puerto en el que el servidor OCSP escuchará (en este ejemplo, 2560).-ignore_errpermite que el servidor continúe operando incluso si recibe peticiones malformadas.-rsignery-rkeyespecifican el certificado y la clave privada del OCSP responder.-CAseñala el certificado de la CA emisora.-text -outguarda un log detallado de las operaciones.
Para consultar el estado de un certificado (por ejemplo, newcert.pem), ejecuta:
openssl ocsp -CAfile /ruta/a/tu/ca.crt -issuer /ruta/a/tu/ca.crt -cert newcert.pem -url http://tu-dominio:2560 -resp_textEsta consulta permite verificar de forma inmediata si el certificado está revocado o sigue siendo válido.
Integrar la generación y publicación de CRL con un servidor OCSP proporciona un mecanismo completo para la gestión de certificados emitidos. Mientras que la CRL ofrece una solución tradicional basada en la descarga de una lista completa, OCSP permite a los clientes obtener el estado de un certificado de forma ágil y en tiempo real, optimizando el proceso de validación y reduciendo la carga en la red. Este enfoque combinado asegura que, tanto en entornos de pruebas como en producción, se disponga de mecanismos robustos para mantener la integridad y seguridad de la infraestructura PKI.
Renovar un certificado
Normalmente, poco antes de caducar un certificado se pide su renovación. Esto emitirá otro fichoero de certificado firmado por la CA como el que se emetió la primera vez, pero con una nueva fecha de caducidad:
./easyrsa renew <nombre-del-certificado>una vez generado el nuevo certificado en:
- issued/mqtt.example.tld.crt – certificado renovado
es buena idea ejecutar el siguiente comando para asegurarse que el viejo certificado queda obsoleto:
./easyrsa revoke-renewed <nombre-del-certificado>esto nos acaba forzando a generar una nueva lista de certificados revocados. O sea, hay que ejecutar:
./easyrsa gen-crly en consecuencia distribuir el nuevo fichero CRL.
Conclusión
Easy-RSA simplifica la creación y gestión de una infraestructura PKI, lo que me permite emitir y administrar certificados para VPNs y servidores web. Sus outputs, como las claves privadas, certificados firmados, y el certificado de la CA, son los componentes esenciales para garantizar conexiones seguras. Con esta herramienta, puedo construir mi propia red confiable para asegurar tanto servidores como clientes en diferentes escenarios.
Referencias
WireGuard Over TCP Using udp2raw: Securing and Expanding Connectivity – Point-to-Multipoint – CookBook
Scenario Overview
The architecture for this setup is illustrated below:

Install udp2raw, Wireguard and generate keys
cd /tmp
wget https://github.com/wangyu-/udp2raw/releases/download/20230206.0/udp2raw_binaries.tar.gz
tar xvfz udp2raw_binaries.tar.gz
cp udp2raw_amd64 /usr/local/bin/udp2raw
rm udp2raw*
# based on Ubuntu
apt install wireguard
# we'll work on /etc/wireguard
cd /etc/wireguard
# generate privatekey
wg genkey | sudo tee /etc/wireguard/private.key
sudo chmod go= /etc/wireguard/private.key
# obtain public key
sudo cat /etc/wireguard/private.key | wg pubkey | sudo tee /etc/wireguard/public.key
When eveything is installend and configured, just run in all endpoints next commands:
sudo wg-quick up wg0
# for status check:
wg
# udp2raw logs at:
tail -f /var/log/udp2raw.log
# enable automatic wireward service in Ubuntu
sudo systemctl enable wg-quick@wg0.service
# start and stop service like always
sudo systemctl start wg-quick@wg0.service
sudo systemctl stop wg-quick@wg0.service
sudo systemctl status wg-quick@wg0.service
Configuration Files
Endpoint A /etc/wireguard/wg0
# local settings for Endpoint A
[Interface]
PrivateKey = WMUerfcUpSxUlOp1UmaS2uwelnk8AxhAFrlIWpjheWM=
Address = 192.168.111.1/24
ListenPort = 51822

# receive wg through udp2raw
MTU = 1342
PreUp = udp2raw -s -l 167.99.130.97:55055 -r 127.0.0.1:51822 -k "The2password." -a >/var/log/udp2raw.log 2>&1 &
PostDown = killall udp2raw || true

# Enable NAT for traffic forwarding (corporate and fallback internet access)
PreUp = echo 1 > /proc/sys/net/ipv4/ip_forward || true
PreUp = iptables -t nat -I POSTROUTING -o eth0 -j MASQUERADE || true
PreDown = iptables -t nat -D POSTROUTING -o eth0 -j MASQUERADE || true

# remote settings for Endpoint B
[Peer]
PublicKey = XWl8HeAinHlAZTvaCXDlmO9n/CQLg5qH8jmtROK4jBg=
AllowedIPs = 192.168.111.2/32
PersistentKeepalive = 120

# remote settings for Endpoint C
[Peer]
PublicKey = I+gi8l9QRe00W8pTpp8CSoIabz/RXXQXwquXj7eKNwU=
AllowedIPs = 192.168.111.3/32
PersistentKeepalive = 120
Endpoint B /etc/wireguard/wg0
# Endpoint B
[Interface]
PrivateKey = +BB3NI2SUYeKcRoPrZE2+Ot5KnLZJBycPzJ17kfbn34=
Address = 192.168.111.2/24

# Route configuration for public IP
PreUp = ip route del default || true
PreUp = ip route add 167.99.130.97 via 10.2.0.1 dev eth0 || true
PostDown = ip route del 167.99.130.97 via 10.2.0.1 dev eth0 || true
PostDown = ip route add default via 10.2.0.1 || true

MTU = 1342
PreUp = udp2raw -c -l 127.0.0.1:50001 -r 167.99.130.97:55055 -k "The2password." -a >/var/log/udp2raw.log 2>&1 &
PostDown = killall udp2raw || true

# Endpoint A
[Peer]
PublicKey = z73wM1b7fhMRA8fmeQw4FntRvgJ9JwTdsQHssXHg3DE=
Endpoint = 127.0.0.1:50001
AllowedIPs = 0.0.0.0/0
PersistentKeepalive = 120
Endpoint C /etc/wireguard/wg0
# Endpoint C
[Interface]
PrivateKey = YCGzsfeed8QumpfE8bdWRheMzBiUsTB7vXj0YVOQQX0=
Address = 192.168.111.3/24
# Route configuration for public IP
PreUp = ip route del default || true
PreUp = ip route add 167.99.130.97 via 10.2.0.1 dev eth0 || true
PostDown = ip route del 167.99.130.97 via 10.2.0.1 dev eth0 || true
PostDown = ip route add default via 10.2.0.1 || true
MTU = 1342
PreUp = udp2raw -c -l 127.0.0.1:50001 -r 167.99.130.97:55055 -k "The2password." -a >/var/log/udp2raw.log 2>&1 &
PostDown = killall udp2raw || true
# Endpoint A
[Peer]
PublicKey = z73wM1b7fhMRA8fmeQw4FntRvgJ9JwTdsQHssXHg3DE=
Endpoint = 127.0.0.1:50001
AllowedIPs = 0.0.0.0/0
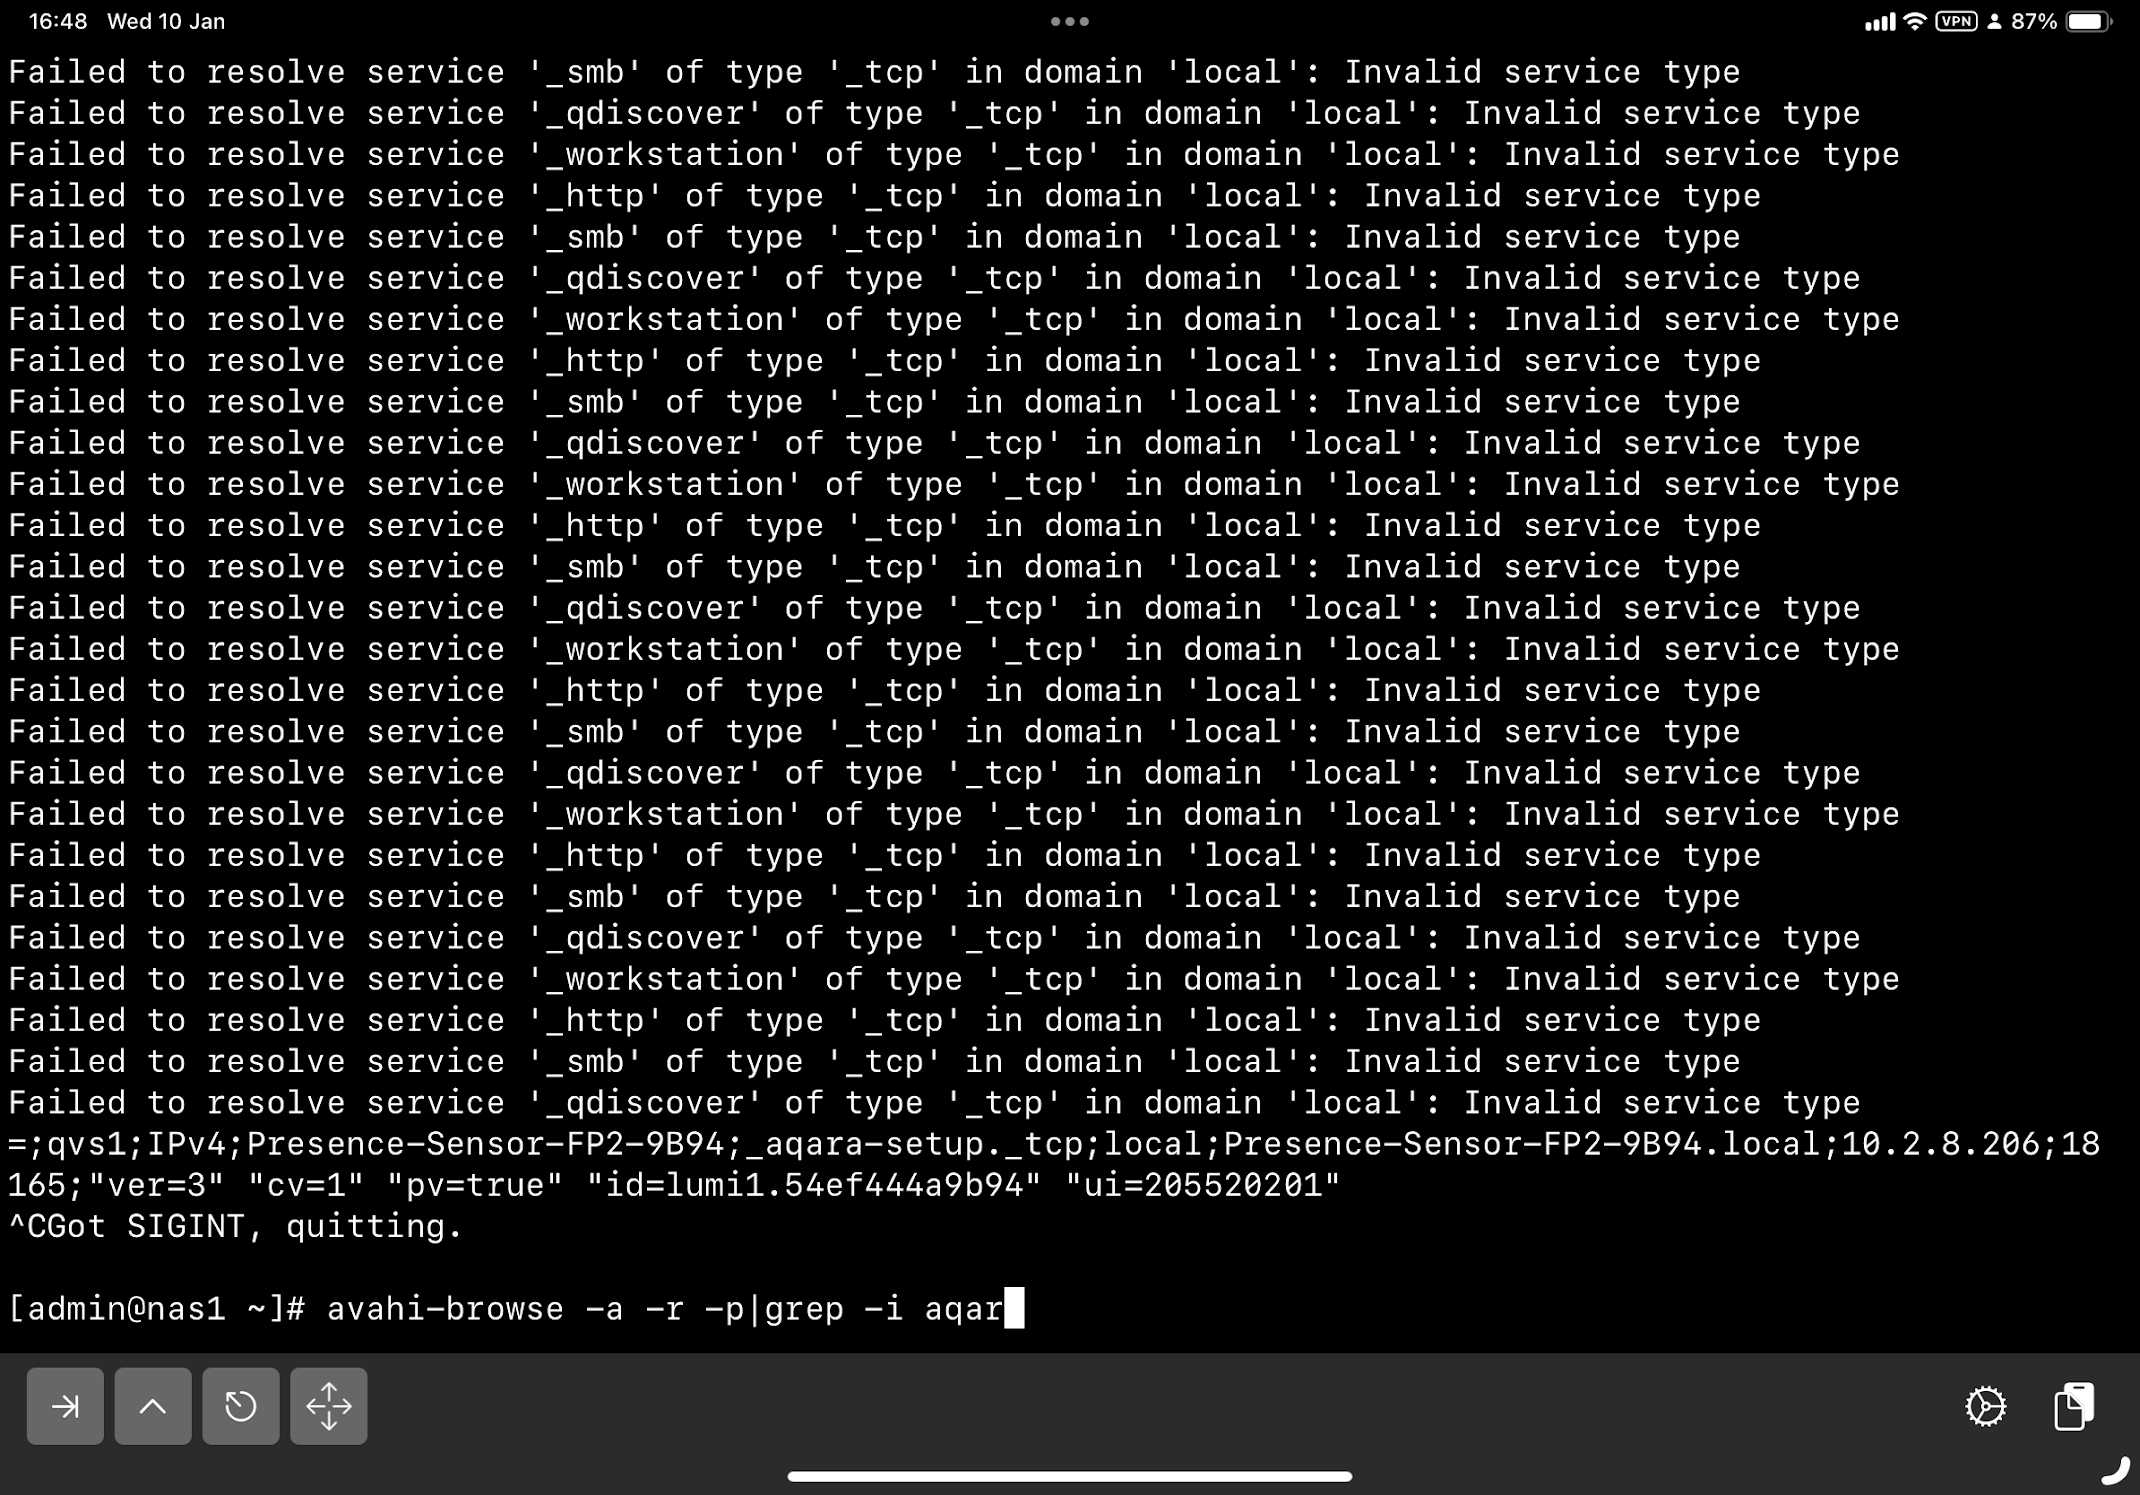
PersistentKeepalive = 120discovering mDNS/DNS-SD
mdns-scan is a simple tool that scans for mDNS/DNS-SD announcements on the local network and lists discovered services. It doesn’t require the full Avahi daemon; it directly uses multicast DNS queries.
$ sudo mdns-scan
+ nas [44:0e:be:62:58:a5]._workstation._tcp.local
+ nas._http._tcp.local
+ nas._smb._tcp.local
+ nas._qdiscover._tcp.local
In the past I used avahi-browse but it requires dbus, and in some systems I don’t use dbus.
WireGuard Over TCP Using udp2raw: Securing and Expanding Connectivity
In this post, I’ll share how I set up a WireGuard VPN over TCP using udp2raw, which provides secure access to corporate networks and serves as a fallback for internet access when customer networks impose heavy restrictions. Inspired by Pro Custodibus, this solution enables IoT gateways to seamlessly connect to both the company’s internal services and the broader internet under constrained conditions.
Scenario Overview
The architecture for this setup is illustrated below:
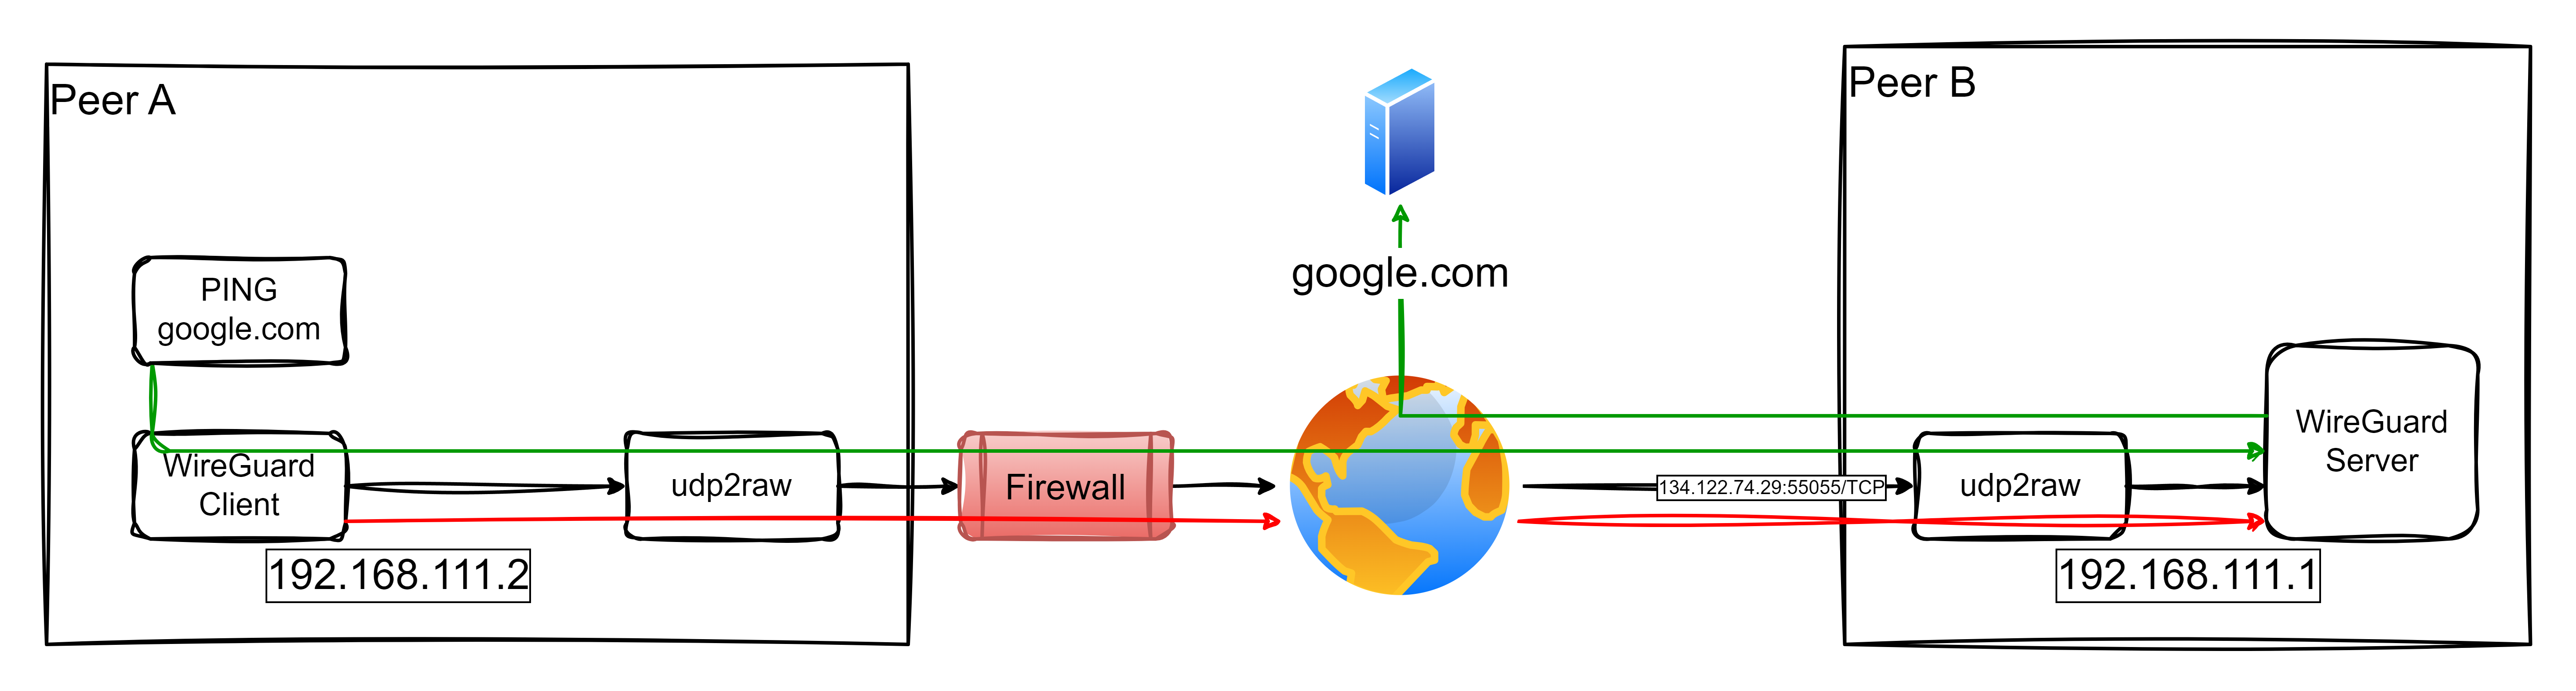
Key Features of the Solution:
- Access to Corporate Networks: IoT Gateways securely connect to the corporate network for accessing internal services.
- Fallback Internet Access: When the customer’s network restricts internet access but allows TCP connections to the company infrastructure, the IoT Gateway routes its internet traffic through the company’s network.
How It Works:
- Endpoint A (Client): An IoT Gateway connects through the restrictive customer network.
- Endpoint B (Server): The WireGuard server is accessible via a public IP (
134.122.74.29) on TCP port55055. - Traffic flows through a TCP tunnel created with
udp2raw, enabling the gateway to securely access the corporate network or relay internet traffic via the company’s infrastructure.
This dual-purpose setup ensures robust connectivity for IoT devices even in challenging environments.
Video Demonstration (in Spanish)
I’ve created a video demonstration in Spanish showcasing the entire setup and functionality of this scenario. The video walks through the following steps:
- Explaining the problem and network constraints.
- Demonstrating the configuration of both endpoints (client and server).
- Showing the connection initiation and testing, including how traffic flows through the VPN tunnel.
- Verifying fallback internet access through the company network.
This video is ideal for those who prefer visual explanations or need extra guidance in implementing this solution.
Configuration Files
1. Endpoint B (server, /etc/wireguard/wg0.conf)
This configuration allows Endpoint B to act as a gateway for both corporate access and fallback internet connectivity:
# local settings for Endpoint B
[Interface]
PrivateKey = EMqyADu4Xeu95ZpNZE97FET5eKzN1WSwBkeBWtX1yGg=
Address = 192.168.111.1/32
ListenPort = 51822

# receive wg through udp2raw
MTU = 1342
PreUp = udp2raw -s -l 134.122.74.29:55055 -r 127.0.0.1:51822 -k "The2password." -a >/var/log/udp2raw.log 2>&1 &
PostDown = killall udp2raw || true

# Enable NAT for traffic forwarding (corporate and fallback internet access)
PreUp = echo 1 > /proc/sys/net/ipv4/ip_forward || true
PreUp = iptables -t nat -I POSTROUTING -o eth0 -j MASQUERADE || true
PreDown = iptables -t nat -D POSTROUTING -o eth0 -j MASQUERADE || true

# remote settings for Endpoint A
[Peer]
PublicKey = Xt70DJy8ldPcDNW4YM2Dt94n16pTQKFxhmvpgKvJyng=
AllowedIPs = 192.168.111.2/32
PersistentKeepalive = 120
Key Points:
- NAT Rules: These rules enable traffic originating from Endpoint A to use Endpoint B for accessing the internet.
- MTU Adjustment: The MTU is set to 1342 to prevent fragmentation issues over the TCP tunnel.
Assumptions:
- eth0, is the name of the interface for reaching Internet.
- 192.168.111.0/24 is available for point-to-point connections in the tunnels.
ud2rawis in PATH.- Don’t re-use my pub and private keys. Neither the pre-shared key of used by
udp2raw.
Endpoint A (client, /etc/wireguard/wg0.conf)
This configuration sets up Endpoint A to route all traffic (corporate and internet) through Endpoint B:
[Interface]
PrivateKey = yAxByb468bAuMdg5S6AlfYkxbeYDOMEKxdaJ7d2p83g=
Address = 192.168.111.2/32

# Route configuration for public IP
PreUp = ip route del default || true
PreUp = ip route add 134.122.74.29 via 10.2.0.1 dev eth0 || true
PostDown = ip route del 134.122.74.29 via 10.2.0.1 dev eth0 || true
PostDown = ip route add default via 10.2.0.1 || true

MTU = 1342
PreUp = udp2raw -c -l 127.0.0.1:50001 -r 134.122.74.29:55055 -k "The2password." -a >/var/log/udp2raw.log 2>&1 &
PostDown = killall udp2raw || true

[Peer]
PublicKey = VUN2JqZiGQ1V46PDoFECw/nMs3/o6n8PvGMV+ad+Hww=
Endpoint = 127.0.0.1:50001
AllowedIPs = 0.0.0.0/0
PersistentKeepalive = 120
Key Points:
- Fallback Internet Routing: The
AllowedIPs = 0.0.0.0/0directive ensures all traffic is routed through Endpoint B, including internet traffic. - Dynamic Route Adjustments: The
PreUpandPostDowncommands manage routes for efficient fallback connectivity.
Here’s the improved Implementation Steps section based on your feedback and expertise in WireGuard and udp2raw:
Implementation Steps
This section outlines the precise steps required to set up the WireGuard VPN over TCP using udp2raw. Follow these instructions carefully for both Endpoint A (client) and Endpoint B (server).
1. Pre-requisites
- WireGuard Installation: Ensure WireGuard is installed on both systems. This can usually be done via the package manager of your operating system (e.g.,
apt install wireguardfor Debian-based distributions). - udp2raw Binary: Download the appropriate
udp2rawbinary from its GitHub Releases Page. Binaries are available for various architectures. For simplicity:- Extract the binary from the tarball (e.g.,
udp2raw_amd64for most x86_64 systems). - Place the binary in a directory accessible from your
PATH(e.g.,/usr/local/bin). - Verify the installation:
which udp2raw udp2raw -h # Should display the help menu
- Extract the binary from the tarball (e.g.,
2. Prepare the Configuration Files
The configuration files should be located at /etc/wireguard/wg0.conf. Each endpoint has its own specific configuration:
- Endpoint A: Use the
wg0.confprovided earlier, replacing placeholders like keys and IPs as needed. - Endpoint B: Use the
wg0.confprovided earlier.
Ensure both files reflect the IP addresses, MTU settings, and public/private keys accurately.
3. Generate WireGuard Keys
WireGuard requires public-private key pairs for secure communication. Generate them as follows:
- Generate the Private Key:
wg genkey > privatekey - Generate the Public Key from the private key:
cat privatekey | wg pubkey > publickey - Place the private key in the
[Interface]section of the respective configuration file (PrivateKey = ...) and the corresponding public key of the peer in the[Peer]section (PublicKey = ...).
Note: Never share your private keys.
4. Start the VPN Tunnel
- Start the Server First (Endpoint B):
- Bring up the WireGuard interface using
wg-quick:sudo wg-quick up wg0 - Verify that the interface is active:
wg show
- Bring up the WireGuard interface using
- Start the Client (Endpoint A):
- Bring up the client WireGuard interface:
sudo wg-quick up wg0 - Verify that the interface is active:
wg show
- Bring up the client WireGuard interface:
5. Test the Connection
Once both endpoints are active, initiate traffic from Endpoint A to Endpoint B. This step ensures the udp2raw TCP socket is properly established and functioning:
- Ping Endpoint B’s WireGuard IP:
ping 192.168.111.1- If the ping succeeds, the connection is working as expected.
- If it fails, check the logs for
udp2rawand WireGuard on both endpoints for errors:less /var/log/udp2raw.log
- Once the initial handshake completes, the tunnel will remain active as long as
PersistentKeepaliveis configured in the client configuration (e.g.,PersistentKeepalive = 120).
6. Validate Fallback Internet Access
To confirm the fallback internet routing through Endpoint B:
- On Endpoint A, run a test to confirm external connectivity:
curl -I https://www.google.com- If the response headers are received, the internet routing through Endpoint B is functioning.
- Verify that the traffic is routed through the WireGuard tunnel:
traceroute google.com
- If fallback internet access fails, ensure that NAT is correctly configured on Endpoint B:
iptables -t nat -L -n
7. Troubleshooting
- Log Files:
- Check the
udp2rawlogs on both endpoints for issues (e.g., MTU mismatches, handshake failures). - Review WireGuard logs for additional details.
- Check the
- MTU Issues:
- If large packets fail but small packets (e.g.,
ping) succeed, reduce the MTU (e.g., to 1280).
- If large packets fail but small packets (e.g.,
8. Automate Startup
To ensure the VPN starts automatically on boot:
- Enable the WireGuard service:
sudo systemctl enable wg-quick@wg0 - Add
udp2rawcommands to a systemd service or thePreUpdirective inwg0.conf(as shown in the configuration files).
With these steps, you now have a fully operational WireGuard tunnel over TCP, enabling secure communication between endpoints and fallback internet connectivity via the company’s infrastructure.
Conclusion
This configuration provides a robust solution for IoT Gateways operating in restrictive environments. By leveraging udp2raw, WireGuard traffic is tunneled over TCP, enabling:
- Seamless Corporate Access.
- Fallback Internet Connectivity through the company network when customer environments impose constraints.
This versatile setup ensures uninterrupted operations and secure communications for IoT devices. Explore the Pro Custodibus guide and udp2raw GitHub repository for additional insights.